DOW S&P Weekly 27th December 2008

DOW Monthly charts

US markets are still in SET-UP A:- drifting lower below the Monthly 50% levels and following the dynamic timeframes lower, eventually pushing the markets into lower lows in 2009.

This is the last week of trading for 2008, so it's important where markets close on the last day, as they will set-up the Primary cycles for 2009 and how far markets will go lower in the new year.

In the mean time next week's trading will still be defined by the 3-week highs, and SET UP B won't occur until there is a Friday close above those highs. (White line)


S&P 500 Monthly charts

SET UP B is the probability of markets moving back towards a 3-point level of 'TIME' before the market continues lower.

In this instance, Price in January would be rotating back towards the Yearly breakouts from 2008, the first Quarterly 50% level in 2009, and also the 3-month highs in January.

We also notice in the forward timeframe that there is now a higher low in the forward monthly timeframe, which often favours higher prices.

I still think all global markets will follow SET-UP B first before continuing lower in 2009, but if it doesn't markets will still go lower in 2009.

DOW S&P Weekly 20th December 2008

DOW Monthly Futures chart

US markets are still in SET-UP A:- drifting lower below the Monthly 50% levels and following the dynamic timeframes lower,eventually pushing the markets into lower lows in 2009.

When we looks at the Aussie Market (click below) we can see that price has been supported around its November lows, but capped below its 3-week highs for a number of weeks now.

http://www.austindex.blogspot.com/


In the DOW and S&P, those 3-week highs have only just caught up with Price with this week's completion of trading.

The Market can only continue higher when there is a breakout of those 3-week highs.

If US markets can close above those 3-week highs in December, then the pattern of price rising upwards from January's 50% level towards the 3-month highs would be the pattern I favour.

This is simply based on price rotating back into the higher timeframe midpoints before the next trend continues lower in the new year.

For every breakout price will normally come back and test the breakout in the next Timeframe and then continue with the trend. A perfect example was October breakout and then the rotation back into the November 50% level, and then Drive down into lower lows in November.

In this instance price in January would be rotating back towards the Yearly breakout @ 10414, the Quarterly 50% level, and also the 3-month highs in January

The ideal set-up for resistance and then the next leg down into lower lows in 2009.

DOW and S&P Weekly

At this stage US markets are consolidating above their Weekly 50% level, and traders should trade on the side of those Weekly 50% level.

Note:- Those 3-week highs in both the DOW and S&P are extremely valid resistance zones, and have been all year"

With these 3-week highs resisting price and finally catching up with price this week, if US markets can't breakout of those highs in December, the bias would be to continue lower in 2009 which is what I think will happen eventually, as markets follow their Primary cycles in the new year.


  • Daily Trading Set-ups & Analysis
  • Index Futures SPI, DOW S&P, & Forex
  • Subscribe to the Trader Premium
  • http://www.datafeeds.com.au/premiumtrader.html


  • DOW S&P Weekly 13th December 2008


    "Those 3-week highs in both the DOW and S&P are extremely valid resistance zones, and have been all year"


    DOW and S&P Weekly

    Last week's report and I had the view that US markets were rising up into the 3-week highs and hit resistance.

    US markets then reversed down into the Weekly 50% level and found support on Friday.

    As long as US markets remain above the Weekly 50% level I have the view that in the Short-term markets are rising higher towards the December 50% levels.

    DOW CASH Yearly

    The white line shown in the above chart is the 3-week highs.

    We can see that the entire year the trend has been heavily dictated by those 3-week highs. Only briefly had price moved upwards in April but quickly reversed back down in May 2008, after reaching the MAY resistance tops.

    And currently those same 3-week highs are resistance any further gains in this month after finding bottoms in the November timeframe.

    And in 2009 we can see where the DOW will end up at.....

    Make no mistake about it, the DOW along with the S&P will be trading around those 2009 lows:


    Dilernia Principle follows 2-timeframe wave patterns, in this instance the Yearly timeframe.
    DOW Monthly Futures

    Currently the Market is in Set-up A:- drifting lower below the Monthly 50% levels and following the dynamic timeframes lower, as the 3-week highs pushes the market lower.

    Eventually price will reach the 2009 Yearly lows, but it still won't be the lows for 2009. But i'll get back to that in a few weeks time in the new Year.

    Set-UP B:- Is what I think will happen or hope to happen.

    SET-UP B is based on a timeframe breakout.

    A Timeframe breakout normally comes back and retests the breakout at the start of the new timeframe, in this instance the Yearly breakout @ 10414 in 2008, and the start of the new Yearly timeframe in 2009.

    Therefore my expectation is that early in the first Quarter price will try to make it's way back towards 10414, and then continue lower, but first we still need to see a Friday close above those 3-week highs.

    That price action meets the Yearly timeframe breakout.

    Once that occurs I would be looking for the next leg of the down trend into the 2009 lows.

    If SET-UP B doesn't occur soon, there is a possibility that SET-UP A continues and markets drift lower from January as the new Monthly timeframe continues the trend lower towards those Yearly lows.

    DOW S&P Weekly 6th December 2008

    DOW and S&P Monthly

    Last week's trading was an extremely tight 5-day pattern, as was the case with most global index and currencies.

    When we look at the Monthly timeframe using the Weekly charts, last Week's trading started on the 30th November and has now closed finally moving into December's timeframe.

    Whether that had anything to do with the tight 5-day pattern is debatable.

    I still have the view that most Global indexes will continue down into lower lows in December and complete the 2-timeframe wave pattern before any potential reversal upwards.

    However, I've always maintained that for any trend to continue lower in 2009, price needs to swing back upwards and move back to the 3rd Quarter breakouts (September).

    This will result in the retesting the 2008 Yearly timeframe lows to verify the breakout and then move lower in 2009.


    DOW and S&P Weekly

    Things begin to get interesting next week......


    The important part on any trend continuating lower, or even any major trend reversal begins with the 3-week channels, in this instance the 3-week highs.

    Any long term trend won't change unless there is a breakout above the 3-week highs, and then continues above the Monthly 50% level.

    This normally occurs with a Friday close above the Weekly highs and the following week continues higher.

    Any continuation of the long term trend (down) normally occurs with price retesting the 3-week highs and then rejecting downward, as it continues with the trend and market path lower Monthly lows.

    Last week's view was a higher Weekly open and a 2 day down move. That played out and then the next 3 day's consolidated.


    Next Week:- I have the expectation that US markets are moving towards the Weekly highs next week.

    Around those highs and the view is resistance ( until broken with a Friday close above), with the expectation of a move down into December's lows to complete the 2-monthly timeframe pattern.


    A breakout and Friday close above those 3-Week highs, and my view is that US markets are moving back towards higher Monthly close in December, as it goes looking to move back to re-test the 2008 Yearly breakout early in 2009.


    The trend remains down and the expectation is that market's will continue down, but any reversal upwards in the medium term will begin with a breakout above those 3-week highs confirmed with a Friday close above them.

    Those 3-week highs in both the DOW and S&P are extremely valid resistance zones, and have been all year.

    DOW S&P Weekly 29th November 2008


    DOW and S&P Monthly

    November lows support, and 4th Week reversal back towards the December 50% levels next week.

    Recent support will disappear next month and any further weakness and the expectation is to move down into December's lows.

    Once those December lows are reached I have the view of global markets making their way into higher prices in early January.


    DOW and S&P Weekly

    Monday's rally and HOOK bar over the Weekly 50% level.....

    Dilernia principle HOOK:- This often results in a higher prices into Friday, confirmed with Tuesday remaining above the Weekly 50% level and the remainder of the days continue higher into Friday.

    At this stage whilst US markets are trading above their Weekly 50% level, the bias is to continue towards the Weekly highs which match the December 50% level:- resistance.


    DOW 5-day pattern

    In last Week's report I was looking for 2 day down move and then a reversal upwards, but when Monday moved above support then the price action was to follow the 5-day pattern higher.

    This resulted in the HOOK Weekly pattern on Monday, and the rest of the week was simply trading on the side of support as it follows the 5-day pattern higher each day.

    In conclusion:-

    I have the view of lower Prices in December and down into December's lows.

    But I have a view that in the short term, whilst prices are above the Weekly 50% level then the market path is to continue towards the Weekly highs and December 50% level.

    However, being a higher Weekly open I have the view that early next week there should be a 2-day reversal to re-test the Weekly 50% level.

    If those 2-day's are able to remain above the Weekly 50% level, then there could be another higher Friday close by next week into the December 50% levels.

    If price isn't able to remain above the Weekly 50% level after a re-test of it.... then early December could see bear-trend continue down into December' lows to complete my 2-month pattern.

    DOW S&P 22nd November 08 Weekly


    DOW and S&P Monthly

    US markets have acted precisely since the breakout of the October lows in the first week.

    1.Price has remained below the October breakout.
    2.Price has retested the breakout to confirm it in the 2nd week.
    3.Price has rotated back into the November 50% level in the last week of October.
    4.Price has move in a 'thrust' pattern from the November 50% level down in November's

    lows this week.

    5.And currently November's lows are supporting the market.

    My view is that price will continue down into December's lows, and form a robust support zone.

    And in late December or early January begin a major swing back towards the Yearly breakouts, which coincide with September's lows this year. (3rd Quarter lows)


    DOW and S&P Weekly

    I think there is going to be a short-term bounce next week, but then continue down in December.

    However:- my preferred pattern would be to see Monday and Tuesday drive down into the Weekly lows (next Week), and then from Wednesday up into Friday continue higher back towards the December balance point.

    What's going to push the market higher is Financials, and banking stocks aren't ready for any moves higher other than short-term 3-5 day up moves.

    December's lows complete the double monthly low pattern, which can provide a relief rally similar to when the double monthly lows pattern occurred in March 2008.

    DOW S&P Daily 15th Nov 2008 Weekly


    S&P Quarterly and Yearly

    4th Quarter breakout forms resistance and the expectation of lower lows in 2009..

    DOW and S&P Monthly


    Expectation that Global Index markets would swing back into the November 50% level and then continue down into November's lows.

    At this stage the expectation is that November's lows will form a robust support zone, but continue lower into December's lows.....

    Dilernia Principle:- 2 timeframe wave pattern on the breakout.

    Once December's lows are reached, then there is an expectation that market will swing back up to retest the Yearly low breakout (Septembers lows), and then continue down in 2009.

    DOW Weekly

    November's lows should be reached next week, which will coincide with the G20 meeting giving markets enough reason to reverse off their lows and swing back into the Weekly 50% level.

    But because of the monthly 2 timeframe wave pattern, I've modelled a lower low in December before the market reverses back upwards.

    With most breakout patterns price will come back and re-test the break before it continues lower.

    We saw this with the October low breakout and now the continuation down, and I expect that market will swing upwards to re-test the Yearly breakouts and then continue down in 2009.


    DOW 5-day pattern

    Last Week's sell off was all about Monday continuing lower and then the breakout pattern on Wednesday.

    Once Monday was trading below support there was an expectation of a 2 timeframe wave pattern down into Tuesday's lows.

    And the rest of the Week in US markets was text book patterns....

    Wednesday below the blue channel would result in a 5-day breakout.

    Thursday would continue down into lower lows and then swing upwards into a higher Daily close.

    This pattern was simply a 'short-timeframe' retest of the breakout, and then...

    Friday would continue back down into the blue channel.


    • Daily Trading Set-ups & Analysis
  • Index Futures SPI, DOW S&P, & Forex
  • Subscribe to the Trader Premium
  • http://www.datafeeds.com.au/premiumtrader.html


  • DOW S&P Daily 8th Nov 2008 Weekly

    DOW and S&P Monthly charts

    October low breakout and expectation of price testing the November 50% levels and then continuing down into the November lows.

    Last Week reversed into the Monthly 50% level and sold off....


    DOW and S&P Weekly

    Any continuation down will be defined by the Weekly 50% level.

    At this stage price is trading below the Weekly 50% level, and Friday's trading is often a probability pattern which goes back and re-tests the 50% level and then continues down the following week.

    If Friday was actually Tuesday, then I would favour more weakness down into the Weekly lows.

    However Monday next week will actually be back above the Weekly 50% level.

    Above the Weekly 50% level and the view is price is moving back towards the November 50% levels and Weekly highs.

    Basically any down trend needs to sell off on Monday......

    Last Week's sell off began with a breakout of support on Wednesday.

    In conclusion:- my view still stands that markets are heading down into November's lows

    However:- if price doesn't break Monday's support,(Monday sell off) then the view is, price will probably end up back around the Weekly highs by Friday next week.


    • Daily Trading Set-ups & Analysis
  • Index Futures SPI, DOW S&P, & Forex
  • Subscribe to the Trader Premium
  • http://www.datafeeds.com.au/premiumtrader.html


  • DOW S&P Daily 1st Nov 2008 Weekly

    DOW and S&P Yearly

    US markets trading below 4th Quarter lows, and at this stage are struggling to get back over those lows.

    At this stage it's too early to say whether US markets will continue up towards the 3rd Quarter breakout ( September's lows) but it's something I think will happen.

    Once that happens then my view remains lower prices in 2009.


    DOW and S&P Monthly Futures

    11th October Weekly Report:- "A Monthly and Quarterly close below the Yearly lows constitutes a breakout, which will lead to further erosion in stocks prices in the 4th Quarter...and a bear market and then another leg down into 2009

    October lows resistance (breakout forms resistance), and the trend guide for the 4th Quarter will be defined by the November 50% level.

    If that's the case:- then around November lows could provide the ideal 'swing' low for a swing back towards the 2008 lows breakout"


    Since that Report the Market has reversed back up into the October low breakout and reversed back down.

    This often occurs to verify the breakout, which more often than not leads to further weakness into the extended lows in the following month:- November lower lows

    At this stage:- whilst price is below the November 50% level the expectation is that price is going to continue down into November lows.

    DOW and S&P Weekly

    Are US markets market going to continue up towards the November 50% levels early next week, or reverse down from next week and continue down into November lows?

    I can't answer that until things begin to unfold... but a higher Weekly open and trading below the Monthly balance points, can easily sell down at the start of next week.

    However certain things need to happen to verify any reversal.

    Last Week was the first time that US markets have been able to 'HOOK' above the Weekly 50% levels and continue up into a higher Weekly close since August.

    That's a good sign, but last time markets were above the Monthly balance points.

    If there is going to be higher prices, basically Monday has to continue higher, and not reverse down from the 'Red' levels and close below the Weekly 50% levels....

    That's certainly not a good sign for November.

    But that favours my 11th October Report:- if price can move down into November lows, this will be the pattern that I think should finally get more Buyers appear pushing the market higher into the close of the 4th Quarter....

    But will eventually lead to lower prices in 2009.


    S&P 5-day pattern

    Last week's rally was already modelled before it even started.

    Once the 5-day blue filter crossed over from above to below on Monday... the breakout above the 5-day 50% level on Tuesday lead a rally to the 5-day highs.

    This resulted in a HOOK pattern above the Weekly 50% level

    And then the expectation were higher prices by Friday trading support each day:- higher weekly close by Friday.

    DOW S&P Weekly 25th October 2008

    DOW and S&P Yearly

    Nothing has changed in what I've been saying for months, lower prices in 2009.

    There is a 4th Quarter breakout (below 3rd Quarter lows), therefore the expectation remains that prices will remain below Septembers lows.....

    DOW and S&P Monthly

    October low breakout and expectation that November 50% level is the trend guide with further weakness down into November lows.

    Exact levels will be defined after next weeks trading.


    DOW & S&P Weekly

    This week saw a lower weekly open a move back into the 50% level and then a rejection down towards the Weekly lows.

    Next Week:- same pattern expectation


    S&P 5-day pattern

    "October lows resistance (breakout forms resistance), and the trend guide for the
    4th Quarter will be defined by the November 50% level.

    In the Short-term:- Hedge funds will continue to play around with the same 5-day pattern each day, and the Weekly ranges (green) shown in the Daily chart should be the trend guide for next Week"............ 11th October Weekly report

    This week saw price follow the 5-day patterns precisely:- rotate...extend...rotate.

    I expect next week to be no different.


    DOW S&P Weekly 18th October 2008

    DOW Yearly

    DOW trading in a range below the Yearly 2008 lows with the expectation that price will continue lower in 2009

    S&P Yearly

    Same expectation:- Price to remain below these lows in the 4th Quarter and then continue down into 2009 low.

    DOW and S&P Monthly Futures

    "October lows resistance (breakout forms resistance), and the trend guide for the 4th Quarter will be defined by the November 50% level.

    Price will make it's way back towards the breakout of the 2008 lows late in this 4th Quarter or early in the first Quarter in 2009 and continue lower from 2009."


    Previous Weekly report

    At this stage the expectation remains that price will remain below October lows and then most likely move down into November's low:- Thrust pattern from the 50% level.

    Once it reaches November lows, I'd begin to look for price to begin to make it's way slowly upwards :- retest the Yearly breakout lows (September's lows as shown above)

    DOW 5-day pattern


    "In the Short-term:- Hedge funds will continue to play around with the same 5-day pattern each day....

    Because if price remains below the October lows and closes below the October lows on the last day of this month, then there is an expectation that price will continue down into November lows" Previous Weekly Report

    And I expect the same to continue for the next couple of weeks until the end of October....

    Day traders:- Simply Trade the 5-day patterns of support/resistance

    • Daily Trading Set-ups & Analysis
  • Index Futures SPI, DOW S&P, & Forex
  • Subscribe to the Trader Premium
  • http://www.datafeeds.com.au/premiumtrader.html


  • DOW S&P Weekly 11th October 2008

    "The worse case scenario, which I didn't want to see is now playing out.

    A Monthly and Quarterly close below the Yearly lows constitutes a breakout, which will lead to further erosion in stocks prices in the 4th Quarter...and a bear market of lower lows into 2010.

    At this stage Prices are looking to go lower and will struggle to remain above the October 50% level, and probably sometime in the next quarter the S&P will end up around 1000 before any potential reversal up into the Yearly 2009 50% level, and then another leg down into 2009"


    Previous Weekly report


    DOW Weekly.....

    I expected weakness in the 4th Quarter, and I expected another down leg in 2009, but I didn't expect the carnage that occurred this week.

    Once last Friday closed below the Yearly lows (support) on the last day of the Month and Quarter the only way was down, with the DOW moving into 100% breakout of the range before finding any support in the market.

    There are still over 2 months to go before this year ends, but where price closes in 2008 will determine how far markets go down into 2009.

    As previously pointed out, the lower it closes in 2008 the further it goes down into 2009.

    The only redeeming factor in this current price action is:- price will go back and re-test the 2008 breakout some time before the market continues down the following year


    S&P Weekly

    I normally have a fair idea on price action and the direction of the market using dynamic support and resistance zones within each higher timeframe.

    The Previous Friday (3rd October) closed below major support zones, therefore I factored in that the 4th Quarter would continue down, but more often than not price moves in Monthly 'step' formations as it travels within the Primary range (Yearly).

    Once price closed below the Yearly lows, my view was that global markets were heading down into the 4th Quarter lows.

    The crash pattern didn't occur until price broke out of those 4th Quarter lows, and then it was a Free-fall:-Market CRASH


    S&P 5-day pattern

    Once the 4th Quarter lows failed to hold there were no more higher timeframe support levels in the market, and each day followed the 5-day pattern of rotating towards the 50% level and then extending outward towards the extreme each day.

    My Market Crash didn't occur until Tuesday:- breakout of the 4th Quarter lows, but it wasn't helped by the previous Friday close below the Yearly lows.

    Hedge funds had a field day due to the size of the trading ranges each day, with Friday having a 1000 point range from top to bottom.


    S&P Weekly and Daily charts

    So what do I Think will happen?

    Long term:- Price will make it's way back towards the breakout of the 2008 lows late in this 4th Quarter or early in the first Quarter in 2009 and continue lower from 2009.

    October lows resistance (breakout forms resistance), and the trend guide for the 4th Quarter will be defined by the November 50% level.

    In the Short-term:- Hedge funds will continue to play around with the same 5-day pattern each day, and the Weekly ranges (green) shown in the Daily chart should be the trend guide for next Week.

    I'm not going to pick the bottom in this market, the first sign will be a move above the 5-day 50% level, but will need to be confirmed with price trading above the Weekly 50% level.

    Because if price remains below the October lows and closes below the October lows on the last day of this month, then there is an expectation that price will continue down into November lows.

    If that's the case:- then around November lows could provide the ideal 'swing' low for a swing back towards the 2008 lows breakout

    S&P DOW Weekly 4th October 2008


    S&P Weekly Cash

    In September US markets had reached their Yearly lows, and the expectation that any up trend in the 4th Quarter was dependant on the October 50% level.

    The best case scenario was:- a 4th Quarter rise but will eventually lead to lower price is 2009.

    The worse case scenario, which I didn't want to see is now playing out.

    A Monthly and Quarterly close below the Yearly lows constitutes a breakout, which will lead to further erosion in stocks prices in the 4th Quarter...and a bear market of lower lows into 2010.

    At this stage Prices are looking to go lower and will struggle to remain above the October 50% level, and probably sometime in the next quarter the S&P will end up around 1000 before any potential reversal up into the Yearly 2009 50% level, and then another leg down into 2009.


    DOW Weekly cash

    A Set-up:- is the best case scenario but will eventually lead to lower prices in 2009.

    B Set-up:- is the one that will probably play out for the rest of 2008, and much less likely that any rises in the 4th Quarter.

    But everything is leading to lower prices in 2009....

    DOW S&P Weekly Report 27th Sept 2008

    S&P Cash Weekly

    US markets found their lows in September and expectation that the last Quarter of 2008 will continue higher and slightly higher in 2009, before continuing lower in 2009.

    But the up move in the last Quarter is simply dependant on the October 50% level.

    DOW and S&P Weekly futures

    All Trends are defined by the 50% levels as price thrusts outward, and price is still below the monthy 50% level.

    With a shift in time price can still continue lower in October, but that's not my view in the last Quarter.

    My view has always remained, once the Yearly lows are reach the last Quarter will rise higher......


    DOW and S&P Daily futures

    And we can see a major shift in resistance in the next few days.

    What was resistance for many months can quickly become support in October, but i'm not expecting any higher moves in October than those highs in the previous Quarter.

    At this stage the view is for the next Quarter to remain in a large trading range between recent lows and previous Quarterly highs.

    So get your 'swing-trading' hats on for the next 3-months.

    DOW S&P Weekly Report 20 Sept 2008


    DOW Weekly

    The DOW and most global markets hit their Yearly lows this week, and as I've pointed out previously, once these lower levels have been reached the expectation is for global markets to begin to move upwards in the next Quarter and close higher at the end of this year.


    S&P Weekly cash:-

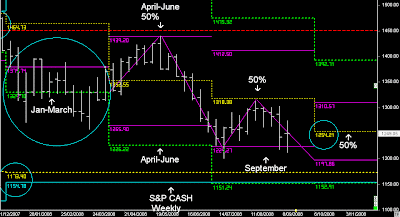
    In 2008 with the breakout of the December lows from 2007, there was a market structure for global markets to move down into their Yearly lows.

    The movement of price down into 1158 was based on the highest timeframe 'dynamic', that being the Yearly, but price will often zig-zag within lesser timeframe 'dynamics' until it gets there, which is often based on each Monthly timeframe.

    Now the lows have been reached in 2008, the first sign of confirming the continuation upwards will need to be verified by a cross over of the October 50% level next month.

    Once that occurs, the view is for the markets to continue towards the 3-month highs.

    As I have been saying for weeks, the markets had to come down lower in this Quarter before a 3 -month counter -trend move upwards, and finally that completed this week....

    However, any UP move in the next Quarter won't stop the inevitable:- global markets will go down into 2009.

    Therefore how high we close in 2008, determines how far we go down into 2009, and global markets will go down in 2009, as shown in the chart above.


    DOW and S&P Futures

    Therefore the September 50% levels are still seen as resistance in this month, but with a shift in the Monthly timeframe in October, if any up trend is going to continue higher then price should be supported above the October 50% level and continue upwards into a higher close in 2008.

    Regardless of any up moves in the next Quarter, and the SPIN you hear that the bear market has ended, there will be another severe down move in 2009

    DOW S&P Weekly Report 13 Sept 2008

    "Down trend continues with the push down from September 50% levels, with a shift in the Monthly balance points:- Expectation for next week is to continue down into next Week's lows .

    If the trend is going to continue down, it wouldn't surprise me to see a re-test of September 50% level in the Week of contract expiry and then for price to continue lower"


    Previous Weekly Report


    DOW S&P Weekly charts

    US markets tested their September levels early in the Week and were pushed lower.

    This Week is contract expiry which often can see higher prices, but I can't see higher prices in US markets based on Market dynamics during this month.

    I still see more sideways prices action with hopefully lower prices in this Quarter.

    S&P Daily

    This Week US markets gaped open higher based on the news that the FED was bailing out Freddie & Fannie, but that didn't last long.

    US markets were pushed back down into their Weekly lows:- Monthly 50% rejection.

    S&P 5-day pattern

    As pointed out in the Premium report :- look for 2-day set-ups using the yellow channels within the Weekly timeframe.

    Trade the break on Tuesday down into the lows. Use Wednesday's 50% level to trade down again.

    Thursday:- was simply trade either side of the Yellow filter, as after a 2-day pattern extension the 3rd day doesn't have a probability on direction.

    As pointed out....if Friday was going to move higher then price would come down into support and bounce closing higher.

    S&P Weekly CASH


    Therefore more sideways action this quarter, with hopefully a push down into 1158-73.

    Whether it gets to 1158-73 in 2008 or not, this is the level that I will feel highly confident in that the 2008 lows have been set and US markets can begin a 3-month upswing to close out 2008.

    Otherwise it's more sideways price action until then....But if prices are trading above the forward 50% level in the new Quarter (October) then the bias is to continue higher in Monthly step formation over the 3-month period.

    • Daily Trading Set-ups & Analysis

  • Index Futures SPI, DOW S&P, & Forex

  • Subscribe to the Trader Premium

  • http://www.datafeeds.com.au/premiumtrader.html

  • DOW S&P Weekly Report 6 Sept 2008

    "The interesting part of the new month is the shift in the balance point in September....

    If US markets are going to continue higher it should start with another 'pop' upwards in September and finally breakout.

    If the trend is going to continue down, as part of my overall view, then the shift in time has resulted in a shift in Monthly support.....

    Below September balance points in US markets, and things don't look so good..."


    Previous Weekly report


    DOW S&P Daily

    Down trend continues with the push down from September 50% levels, with a shift in the Monthly balance points, breaking of the Weekly lows.

    Expectation for next week is to continue down into next Week's lows .

    Previous Weekly low breakout and next Week's 50% level will be viewed as resistance.

    DOW and S&P Weekly Charts

    "US markets remain in a sideways Weekly pattern below the Monthly 50% levels, and still remain below these levels with the 4th Week failing to breakout above....

    I'm still bearish on Markets, as most robust counter-trend rallies begin from the Quarterly lows, and that isn't the case at this stage, even though July's lows were 'BUY' levels, but only towards the Monthly 50% levels and exit 'longs'."

    Previous Weekly Report....

    The Friday close below the 3-week cycle lows isn't a good sign for any higher moves in this quarter....

    If the trend is going to continue down, it wouldn't surprise me to see a re-test of September 50% level in the Week of contract expiry and then for price to continue lower :- 3rd Week sell as per previous Weekly report.

    The bias is to continue lower, but things don't go down in straight lines... they zig-zag between dynamic support and resistance.

    5-day pattern using the filter and high probability patterns this week.

    It started with the 'POP' upwards early in the week using the Monthly balance point towards the 5-day highs, but then reversed down closing below support, which pushes lower the next day.

    As pointed out in Thursday's report:- a break of support on Thursday and price is following Weekly pattern lower with a breakout of the 5-day lows...


    • Daily Trading Set-ups & Analysis
  • Index Futures SPI, DOW S&P, & Forex
  • Subscribe to the Trader Premium
  • http://www.datafeeds.com.au/premiumtrader.html


  •