S&P 500 E-mini Futures 26th November 2011 Weekly Report

The first key level will be next week's level @ 1209.25 and whether the first 2-3 days has an upward bias towards the Weekly 50% level (random resistance)

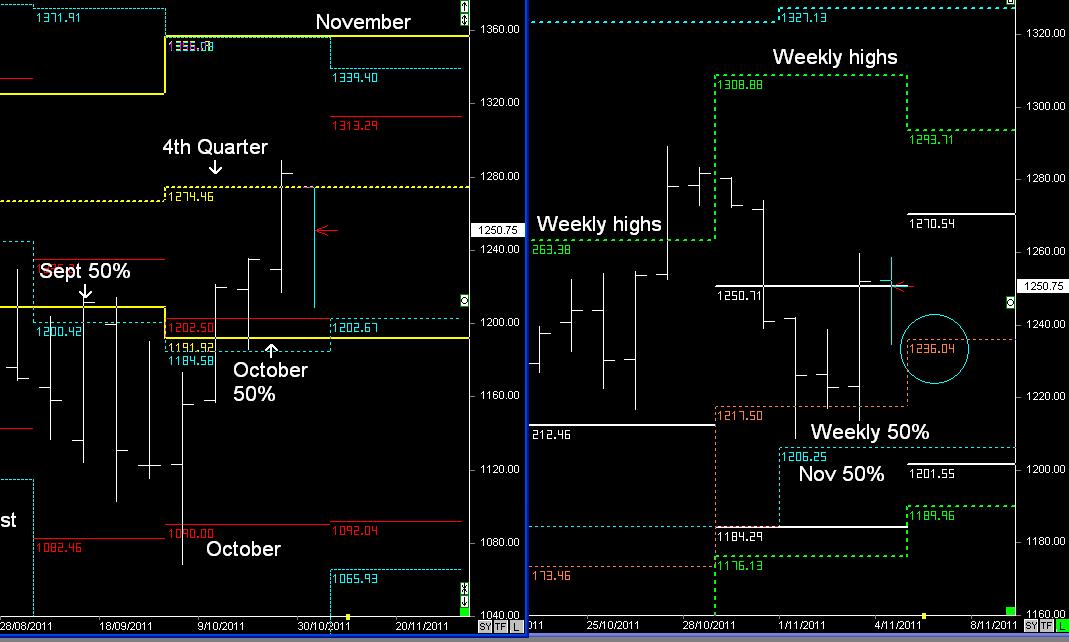
Of course that can quickly change if the market is trading below key Support levels, because a rejection down from the Quarterly 50% levels (1274.50) can often extend towards lower lows in the following Quarter  (January 2012) 


Previous Weekly Report


S&P Monthly and Weekly cycles


My view was that the Markets would remain consolidating until December...

but that quickly changed with this week opening below 1209, and continued with a breakout of the Weekly lows @ 1196.

A breakout of the Weekly lows will normally extend towards next week's lows @ 1128 (random support)

And possibly extend towards the December lows, as part of the push from the 4th quarterly 50% level @ 1274.50

1189-1196 resistance

S&P 500 e-mini 19th November 2011 Weekly Report

1274.50 can continue to act as resistance.

My overall view remains; a sideways consolidating pattern for the rest of the 4th quarter, along with swift short-term down moves of 2-3 days 
Previous Weekly Report


S&P Monthly and Weekly cycles

My view is that the S&P will remain consolidating during the current Quarter, or at least the next 2-weeks

That means remaining above the November 50% level and Weekly lows.

The first key level will be next week's level @ 1209.25 and whether the first 2-3 days has an upward bias towards the Weekly 50% level (random resistance)

Of course that can quickly change if the market is trading below key Support levels as shown in the Monthly chart....

 because a rejection down from the Quarterly 50% levels (1274.50) can often extend towards lower lows in the following Quarter ( January 2012)

S&P 500 E-mini futures 12th November 2011 Weekly Report

My view is that the S&P will remain supported, & continue to consolidate with an upward bias:- Weekly 50% level @ 1236 is the trend

but the position of the 4th Quarterly 50% level @ 1274 could continue to act as resistance over the next 5-days.

Previous Weekly Report

S&P Monthly and Weekly cycles

As per the previous Weekly report...

Trend bias is up, but 1274.50 acted as resistance

Next Week:-

more of the same, 1274.50 can act as resistance, as the market tries to move higher.

Weekly 50% level is the trend guide, along with short-term set-ups within the 5-day range, as per Daily reports.

Keep an eye for any weakness below the Weekly lows @ 1212

My overall view remains; a sideways consolidating pattern for the rest of the 4th quarter, as it tries to continue higher, along with swift short-term down moves of 2-3 days


S&P 500 E-mini Fuutres 5th November 2011 Weekly Report

For those looking at the larger timeframe patterns, the trend bias will be based on the 4th quarterly 50% level @ 1274, as it will dictate whether the trend remains bullish, or rotates back down into the November 50% levels.

Previous Weekly Report

S&P Monthly and Weekly

Last Week I was looking for the S&P to move up into the Weekly highs @ 1308, but then reverse back down.

However, Monday opened below the 4th Quarterly 50% level  @ 1274, and proceeded to move down into the Weekly 50% levels & November 50% level.

Next Week:- Whilst the S&P remains above the November 50% level, the trend bias is up towards the November highs,  but the position of the 4th Quarterly 50% level @ 1274 could continue to act as resistance over the next 5-days.

At this point , my view is that the S&P will remain supported, & continue to consolidate with an upward bias.

Weekly 50% level @ 1236 is the trend guide

Trend remains stable unless it's trading below the Weekly lows @ 1190