S&P 500 31st December 2011 Weekly report

Primary and Weekly cycles

New Primary cycle begins next week, and the S&P 500 will start the year above the year 50% level @ 1235.75.

That's a good sign to begin with.

As long as the S&P 500 doesn't break the Weekly lows and monthly 50% levels  (1203) early in the new year the trend remains stable with an UPWARD bias.

4th Quarter 50% level @ 1274.50 that has formed resistance over the past 3-months has disappeared, and has dynamically moved to a support zone  for the 1st quarter.

In conclusion:- Weekly 50% level and primary cycles 50% levels and seen as robust support zones at the start of next week. (1235.75)

S&P 500 E-mini Futures 24th December 2011

S&P Primary and Weekly cycles

December 50% level Support, and once above the Weekly 50% level @ 1231.50 the trend bias was to close higher.

Short-term the trend is likely to move towards 1274.50 once again.

However, any weakness next week, and the important pattern to keep an eye on it the new Primary 50% level for 2012.

Next Week:- Weekly level @ 1264 is the trend guide on whether the market closes higher.

or closes near the Weekly 50% level, which aligns with the 2012 Yearly 50% level from the 1st of January.

S&P 500 E-mini futures 17th December 2011 Weekly report

S&P Monthly and Weekly

S&P remains stable, as the December 50% level continues to support the trend,
and may continue to do so until the end of this Year.

Weekly levels are the Trend guides for next week

However, coming into the end of the Year and then next Primary cycles appears....(Chart below)

S&P 500 Primary cycle

 The 2012 Yearly 50% level and 1st quarter 50% level is the
 trend guide on whether the trend continues down into the 2012 Yearly lows

S&P 500 E-mini 10th December 2011 Weekly report

S&P Monthly and Weekly

1274.50 could continue to act as resistance until the end of this year.

Weekly 50% level remains the trend guide and random support.

If that's the case, then markets will continue to consolidate and rotate within the 5-day range using intra-day filtering techniques of 8.5 to 14 point ranges.


The next major trend won't develop until the start of 2012, when the new 2012 Yearly 50% level comes into play.. (Chart Below)

S&P Primary Cycle


S&P 500 E-mini 3rd December 2011 Weekly report

A breakout of the Weekly lows will normally extend towards next week's lows @ 1128 (random support)

1189-1196 resistance  (Previous Weekly Report)


                                                   S&P Weekly and Daily

The S&P didn't remain below resistance levels, as positive news came out on funding for European Banks.

This saw the S&P 500 rally into the Weekly highs, and we are back to my original view of markets remaining consolidating within the 4th Quarter.

Next Week:- could continue towards next week's highs, and back towards 1274.50 (Resistance)...

But because of Friday's 5-day high reversal pattern my view is that....

that the market is heading back towards the Weekly 50% level...

and as far as the December 50% level sometime this month (Random Support)

Trend guide 1249.50


S&P 500 E-mini Futures 26th November 2011 Weekly Report

The first key level will be next week's level @ 1209.25 and whether the first 2-3 days has an upward bias towards the Weekly 50% level (random resistance)

Of course that can quickly change if the market is trading below key Support levels, because a rejection down from the Quarterly 50% levels (1274.50) can often extend towards lower lows in the following Quarter  (January 2012) 


Previous Weekly Report


S&P Monthly and Weekly cycles


My view was that the Markets would remain consolidating until December...

but that quickly changed with this week opening below 1209, and continued with a breakout of the Weekly lows @ 1196.

A breakout of the Weekly lows will normally extend towards next week's lows @ 1128 (random support)

And possibly extend towards the December lows, as part of the push from the 4th quarterly 50% level @ 1274.50

1189-1196 resistance

S&P 500 e-mini 19th November 2011 Weekly Report

1274.50 can continue to act as resistance.

My overall view remains; a sideways consolidating pattern for the rest of the 4th quarter, along with swift short-term down moves of 2-3 days 
Previous Weekly Report


S&P Monthly and Weekly cycles

My view is that the S&P will remain consolidating during the current Quarter, or at least the next 2-weeks

That means remaining above the November 50% level and Weekly lows.

The first key level will be next week's level @ 1209.25 and whether the first 2-3 days has an upward bias towards the Weekly 50% level (random resistance)

Of course that can quickly change if the market is trading below key Support levels as shown in the Monthly chart....

 because a rejection down from the Quarterly 50% levels (1274.50) can often extend towards lower lows in the following Quarter ( January 2012)

S&P 500 E-mini futures 12th November 2011 Weekly Report

My view is that the S&P will remain supported, & continue to consolidate with an upward bias:- Weekly 50% level @ 1236 is the trend

but the position of the 4th Quarterly 50% level @ 1274 could continue to act as resistance over the next 5-days.

Previous Weekly Report

S&P Monthly and Weekly cycles

As per the previous Weekly report...

Trend bias is up, but 1274.50 acted as resistance

Next Week:-

more of the same, 1274.50 can act as resistance, as the market tries to move higher.

Weekly 50% level is the trend guide, along with short-term set-ups within the 5-day range, as per Daily reports.

Keep an eye for any weakness below the Weekly lows @ 1212

My overall view remains; a sideways consolidating pattern for the rest of the 4th quarter, as it tries to continue higher, along with swift short-term down moves of 2-3 days


S&P 500 E-mini Fuutres 5th November 2011 Weekly Report

For those looking at the larger timeframe patterns, the trend bias will be based on the 4th quarterly 50% level @ 1274, as it will dictate whether the trend remains bullish, or rotates back down into the November 50% levels.

Previous Weekly Report

S&P Monthly and Weekly

Last Week I was looking for the S&P to move up into the Weekly highs @ 1308, but then reverse back down.

However, Monday opened below the 4th Quarterly 50% level  @ 1274, and proceeded to move down into the Weekly 50% levels & November 50% level.

Next Week:- Whilst the S&P remains above the November 50% level, the trend bias is up towards the November highs,  but the position of the 4th Quarterly 50% level @ 1274 could continue to act as resistance over the next 5-days.

At this point , my view is that the S&P will remain supported, & continue to consolidate with an upward bias.

Weekly 50% level @ 1236 is the trend guide

Trend remains stable unless it's trading below the Weekly lows @ 1190

S&P 500 E-mini 29th October 2011 Weekly Report

Consolidation above the October 50% level will help set-up further gains later in the week, as the trend follows the weekly cycles

And the current price action suggests the trend will continue towards 1274 by November


Previous Weekly Report

 
S&P Monthly and Weekly cycles

Break and extend pattern in the Weekly cycles should continue up into next week's highs, and then reverse back down into the this week's high, as part of retesting the breakout....

and as low as 1250.75


Once that occurs I'd be looking for further gains towards the November highs, using 1250.75 as support.

For those looking at the larger timeframe patterns, the trend bias will be based on the 4th quarterly 50% level @ 1274, as it will dictate whether the trend remains bullish, or rotates back down into the November 50% levels.

S&P 500 E-mini Futures 22nd October 2011 Weekly Report

likely to follow the Weekly cycles towards new highs


And whilst the trend is above 1184/1191, it's following a move towards 1274.50 by November

Previous Weekly report

S&P Monthly and Weekly cycles…

Consolidation above the October 50% level earlier in the weekly help set-up further gains later in the week, as the trend follows the weekly cycles

And  the current price action suggests the trend will continue towards 1274 by November

Once again the levels in the 5-day cycle should hopefully provide a number of ideal/high probability trading set-ups.

S&P 500 E-mini futures 15th October 2011 Weekly report

Weekly 50% level along with the patterns in the 5-day range (daily report) will decide on whether the trend continues up towards the monthly 50% level and upper weekly levels.

At this stage I can't see any bullish signs that's going to push the S&P towards 1274 during the 4th quarter. (Previous Weekly report)


                              S&P monthly and Weekly cycles.

We’ll now I can see the bullish signs that’s going to push the S&P towards 1274 during the 4th Quarter…

That began with the consolidation above the October 50%  earlier in the week, and if you follow the Daily reports, the most robust set-ups aligned with Thursday’s support and Friday’s BUY set-up


Next Week:- likely to follow the Weekly cycles towards new highs (double Weekly highs & Random resistance @ 1246.50)

Note:- Whilst the trend is above 1284/1291, it's following a move towards 1274.50 by November

Once again the daily cycles will provided set-ups within the 5-day range, as price moves within the lines of least resistance.

S&P 500 E-mini futures 8th October 2011 Weekly report

 the Weekly levels @ 1090 could provide another swing point...

but sometime during the next 4 weeks my view is that price will move down towards 1045.


Previous Weekly Report

S&P Monthly and Weekly cycles


The S&P formed a double low pattern in the 3rd quarter using 1090 as the swing/support level in the Weekly cycles  (Note:- Tuesday's 5-day lows @ 1068 were the precise low)

However, when we compare the price action in the S&P 500 to the price action in the Australian market, we can see the lack of strength in the market on Friday.

The Weekly close doesn't show the same bullish pattern, as it has failed to close above any key resistance levels

Next Week:- Weekly 50% level along with the patterns in the 5-day range (daily report) will decide on whether the trend continues up towards the monthly 50% level and upper weekly levels, or not

At this stage I can't see any bullish signs that's going to push the S&P towards 1274 during the 4th quarter.

S&P 500 E-mini futures 1st October 2011 Weekly report

My view is that the trend will continue down towards the September lows, with a possible dip down as low as 1045 in October.

Once that occurs my view is that the downward trend will stabilise for the rest of 2011, and move into a 4th Quarter consolidation pattern.  (previous Weekly Report)

S&P Monthly and Weekly cycles

S&P didn't continue down into the September lows, but instead the Weekly level and pattern in the 5-day range @ 1117 provided a short-term (2-day rise) swing point.

However, later in the Weekly the trend resumed its course, which is towards the October lows that now matches my target in the Primary cycle @ 1045

Next Week:- the Weekly levels @ 1090 could provide another swing point...

but sometime during the next 4 weeks my view is that price will move down towards 1045.

S&P 500 E-mini futures 24th September

Traders should keep an eye on the Weekly level @ 1218.

if below at the start of next week, then look for a 2-day reversal pattern. If price breaks out of the 5-day lows on Tuesday, then the trend will continue lower for the rest of the week...


Previous Weekly Report


S&P Weekly cycles

Breakout of the 5-day lows occurred on Wednesday @ 1178, matched with the Weekly 50% level, and the rest of the week has continued lower.

My view is that the trend will continue down towards the September lows,  with a possible dip down as low as 1045-56 in October.

Once that occurs my view is that the downward trend will stabilise for the rest of 2011, and move into a 4th Quarter consolidation pattern.

This will set-up new levels for 2012 for a possible move towards new lows in 2012.

S&P 500 E-mini 17th September 2011 Weekly report

S&P Monthly and Weekly cycles

I was looking for more weakness this week, as part of a move towards the September lows, but instead the market remained within the weekly channels, with Friday closing on its 5-day high.

Friday's close has the potential to see more gains next week, but unless the market breaks out of the weekly highs @ 1241, the current trend can quickly reverse back down.

Traders should keep an eye on the Weekly level @ 1218.

if below at the start of next week, then look for a 2-day reversal pattern.

if price breaks out of the 5-day lows on Tuesday, then the trend will continue lower for the rest of the week

if price bounces off the 5-day lows on Tuesday and closes higher, then next week could see more gains

S&P 500 E-mini futures 10th September 2011 Weekly Report

S&P Monthly & Weekly cycles

HOOK pattern earlier in the Week saw the S&P rise back towards upper resistance levels...

As per previous Reports.....

Expectation is that the trend is continuing down into the September lows

     Next Week:- Weekly levels are the trend guides, along with patterns & trading set-ups in the 5-day range

S&P 500 E-mini Futures 3rd September 2011 Weekly report

my hunch is that price continues to move up towards the Weekly highs, which are seen as resistance.

Once the next 5-days are over, then the week after next will let us know whether the trend follows the September low pattern using the Monthly 50% level as the trend guide.

If that happens then my bet is that Obama will announce QE3 somewhere around those September lows, which will underpin the trend for the rest of 2011  (Previous Weekly report)


S&P monthly and Weekly cycles.


Current price action has played out accordingly, with August lows supporting the trend, the market moving up into the Weekly highs, and then selling down from the Weekly highs.

Further weakness  was confirmed with Thursday’s close below the key weekly trend levels, and Friday followed, as part of a September 50% level rejection pattern towards new lows

My view is that over the next 10-days the market moves down towards the September lows.

 I previously said that the down trend is towards 1045 & the Yearly lows, but it might not get that low...as the target  is now 1078-1085 based on the Weekly cycles.

 I'd  keep an eye on any 'lame' Obama announcements around those lows (or 1045), as this will underpin the market for the rest of 2011.


Note:- in the short-term it won't surprise me to see the S&P move upwards as part of a 2day 'stall-reversal pattern', using the Weekly 50% level as the trend guide...
 
But i'd be surprised to see the market trading above 1217 over the next 5-days.
 
Trend bias is DOWN, helped by the Weekly levels.

S&P 500 E-mini Futures 27th August 2011 Weekly report

Next Week:- price remains above 1115 and likely to swing upwards, but then make a move towards the September lows in the following Month.

(Last Week's Report)


S&P Monthly and Weekly cycles

August lows @ 1115 continues to support the trend, resulting in the market rotating back towards the Weekly 50% level @ 1177, which formed resistance.

Next Week:- the S&P could move back down into the Weekly 50% level @ 1148, but my hunch is that price continues to move up towards the Weekly highs, which are seen as resistance.

Once the next 5-days are over, then the week after next will let us know whether the trend follows the September low pattern using the Monthly 50% level as the trend guide.

If that happens then my bet is that Obama will announce QE3 somewhere around those September lows and 1045, which will underpin the trend for the rest of 2011

S&P 500 E-mini Futures 20th August 2011 Weekly report

Next week normally begins with a 3 day UP move, as part of retesting the previous Weekly breakout. If that occurs, then traders should begin to look for shorts once again from Thursday onwards.

And if everything goes to plan, the market slowly unwinds and begins another downward leg into September lows.


Previous Weekly Report
 
S&P Primary and Weekly cycles

3-day UP-Move failed to move as high as 1245 (August 50% level), as the 3rd quarterly level @ 1208.50 stalled the market from rising further.

As noted in last week's report, and also described in my book, after the 3rd day up move in the 3rd Week, the next short sell pattern happens on Thursday.

Often that begins after the cash market closes on Wednesday, and aligned with resistance levels. This time  it was validated by the same sell-set-up but with price trading below the 5-day 50% level @ 1178

Next week:-

if price remains above 1115 then it's likely to swing upwards, but then make a move towards the September lows in the following Month.

Otherwise the overall trend bias is to continue down into the 2011 Yearly lows @ 1045, and as low as 1015


S&P Futures E-mini 13th August 2011 Weekly

the trend can often drop down from those levels and continue down into the August lows later this Month @ 1115


Those August lows, will once again be another long term swing point (BUY), that should see the market stabilise and move upwards into a large consolidation pattern for the rest of 2011.

Previous Weekly report


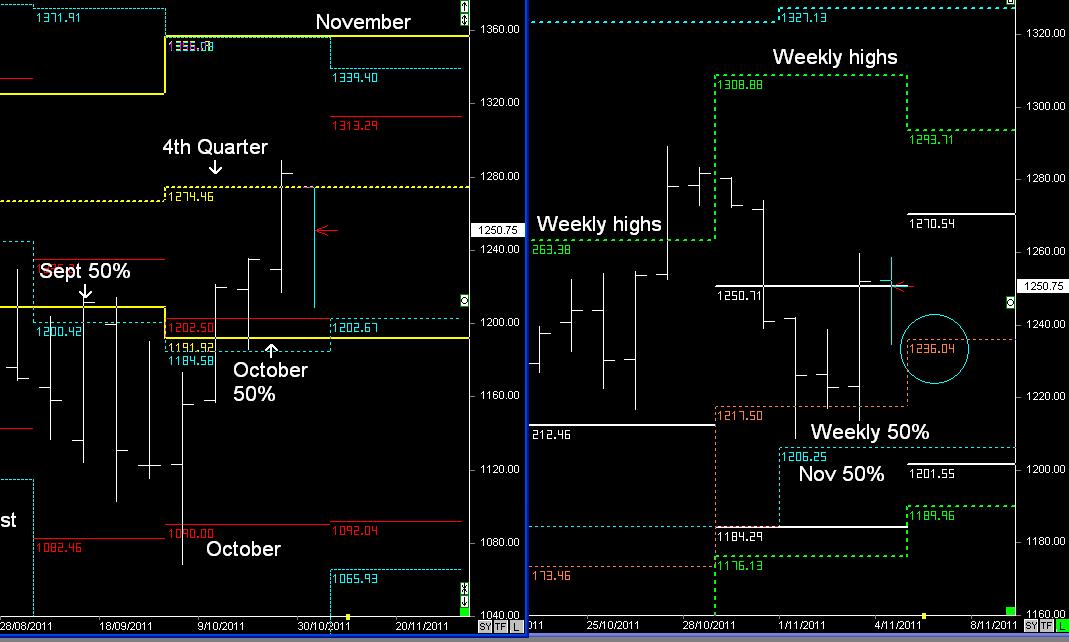
S&P Primary and Monthly cycles

Last Week’s price action was exaggerated on the news of the credit downgrade in the US, but we completed the move into the August lows @ 1115 quicker than expected

Because of the downgrade and the subsequent move into the August lows,  the price action has been in fast forward, and this gives a couple of conflicting patterns.

If it followed my original analysis and moved down into the August lows in the last week of the month  and dipped slightly lower in September, then the upward reversal pattern would normally last for the next 2-3 months, as it follows the monthly cycles:- October and then into November's highs.


Weekly report continues below....

S&P Monthly and Weekly cycles

However, let me stick to the original analysis, and the expectation of a 3rd week rally.

The 3rd week is next week, and begins with price trading above the Primary support levels @ 1169/73, combined with price trading inside the Weekly range @ 1169.

A 3rd Week rally normally begins with a 3 day move, as part of retesting the previous Weekly breakout.

That previous breakout is 1271, but it might fail at the August 50% level @ 1245.

If that occurs, then traders should begin to look for shorts once again from Thursday onwards.

And if everything goes to plan, the market slowly unwinds and begins another downward leg into September lows.


Note;- the conflicting pattern won't be known until September begins, because the next monthly 50% level will decide whether the trend makes a move towards the September lows..

or actually forms support, and the market follows the 2-3 month  upward move.

In the short-term:-  if the market rallies upwards for the next 3-days and closes on its highs by Wednesday, then from Thursday onwards becomes interesting.
 
                                                                      Trend guide 1169/1173

S&P 500 Emini futures 6th August 2011 Weekly

S&P Primary and Weekly cycles

August 50% level rejection pattern @ 1311, has led to as 'thrust' pattern downward:- top-to-bottom 5-day cycle.

This then resulted in a breakout of the Weekly lows @ 1272, and also below the 3rd quarterly 50% level @ 1266

Once that occured, then the Primary cycle takes over, sending the S&P 500 down into the primary support levels @ 1169/1273


1169/73 is a major support, and the 3rd Quarterly 50% level @ 1266 is a major resistance zone over the next 2-months.

Even though the trend has found support, my view is that it will double dip into August lows.


In my new book there is a section that clearly describes the current market conditions from pages 120 to 130, which spells out the possible price action over the next 2-3weeks, as described below..

S&P Monthly and Weekly cycles

If the current price action follows those text-book patterns, then the trend should move up into the Weekly level and then continue down into this week's lows @ 1144.


That pattern will complete the break and extend pattern from last week's lows @ 1272

If that plays out, then the following week should begin with a 3-5 day rally, that could go as high as the Quartertly 50% level @ 1266

Once that plays out, then the trend can often drop down from those levels and continue down into the August lows later this Month @ 1115

Those August lows, will once again be another long term swing point (BUY), that should see the market stabilise and move upwards into a large consolidation pattern for the rest of 2011.

Therefore over the next 3-weeks there should be a lot of volatility, and if it plays out as described then there's good money to be made
 
Of course it might not do any of that., but lets see how it goes.

Footnote:- This week's report was written before Standard and Poor downgraded the US credit rating from AAA to AA+, how it changes the analysis over the next 5-days is yet to be seen

S&P (E-mini) 30th July 2011 Weekly

there is a stench hanging over the S&P if the US fails to raise it’s debt ceiling coming into August.... and if for some reason that happens then it could easily break the support levels (Weekly lows)...

(Previous Weekly report)

S&P Weekly cycles

Nothing has been resolved on the debt ceiling, and weakness in the S&P 500 was set-up on Wednesday with a break of the 5-day channel @ 1327, resulting  in a break out of the 5-day lows, and further weakness with the market closing below the Weekly lows.
 
And if nothing is resolved regarding the debt ceiling over the weekend, then the trend should continue to move down into the Weekly lows, and the 3rd quarter 50% level 1266. (random support)
 
Next Week:-  if trading the S&P 500 on a daily basis, then the levels in the Weekly and Monthly ranges should be used, along with the patterns in the 5-day range, whilst focusing on  taking 8.5 to 14-point range movements.

S&P (E-mini) 23rd July 2011 Weekly report

Trend guide is simply based on the Weekly 50% level @ 1318...whilst trading set-ups within the 5-day range....Next week:- likely to remain range bound between the Weekly levels. (previous Weekly report)

S&P Weekly cycles

S&P remained within the Weekly levels, with Wednesday’s price action helping to set-up a move towards the upper weekly level @ 1346.

Next Week;- there is a stench hanging over the S&P if the US fails to raise it’s debt coming in August.

If for some reason that happens then it could easily break the support levels (Weekly lows)

However, if I concentrate of the current price action alone, then my view is that next week will rise upwards, and continue to move towards the highs in July @ 1374.

Whilst looking for set-ups within the patterns in the 5-day range to help validate that view.

S&P (e-mini ) 16th July 2011 WEEKLY

A weak pattern won’t eventuate unless the market breaks out of the 5-day lows and begins trading below 1325... be aware of patterns within the 5-day range, that may show set-ups with potential weakness using the intra-day daily channels.

 Previous Weekly report

S&P Monthly and Weekly cycles

The 5-day low breakout occurred on Monday, and the S&P remained below 1325 for the rest of the week.

However, the trend didn't continue down towards 1266, but it instead remained supported around its Weekly 50% level.

Therefore next week's trend guide is simply based on the Weekly 50% level @ 1318...whilst trading set-ups within the 5-day range.

Next week:-  likely to remain range bound between the Weekly levels.

And what's going to push the S&P in either direction will be determined by the decision around raising the debt ceiling in August

If they raise it, it should help lift the market, and if they don't it could push the S&P down towards 1266

S&P (e-mini ) 9th July 2011 WEEKLY

S&P will travel to next week’s highs @ 1350 as part of the break and extend pattern from 1295

my view is that 1348-52 will act as resistance for the next 3-5 days....


 Previous Weekly report

S&P Monthly and Weekly cycles

S&P completed the break and extend pattern from 1295 into 1350, which formed resistance on Friday.

The Trend in the S&P remains stable, as long as it remains above 1325 and the 3rd quarterly level.

And based on the current price action, the market looks like it will continue towards next week’s highs, and then as high as the July level @ 1374

A weak pattern won’t eventuate unless the market breaks out of the 5-day lows and begins trading below 1325, and there isn’t a set-up in the current cycles that’s going to pre-empt that break.

Therefore the trend bias is to continue upward, but be aware of patterns within the 5-day range, that may show set-ups with potential weakness using the intra-day daily channels.

S&P (e-mini ) 2nd July 2011 WEEKLY

there is enough reason why the S&P could rise upwards in the last week of the 2nd Quarter.

and if the S&P rises upwards, then the 3rd Quarterly high around 1325 will probably form resistance and push the market lower once again.
(Previous Weekly report)


S&P monthly and Weekly cycles.

The confirming pattern to validate the reversal pattern started with a breakout of the Weekly highs @ 1295 on Wednesday

There were two patterns that were going to play out :-

#1 how price responds to the Monthly 50% levels? and as we can see the market opened above the July 50% level @ 1313

#2 how far price travels as part of the Weekly break and extend pattern?

The answer is that the S&P will travel to next week’s highs @ 1350 as part of the break and extend pattern from 1295

Fundamentally, some would say W.T.F. just happened, but technically the price action is not unusual, even though the speed of the move even caught me out, with the lack of minor intra-day pullbacks within the daily range (5-day pattern trading & 8.5 points)

Next Week: - my view is that 1348-52 will act as resistance for the next 3-5 days....

And then the 3rd quarterly level @ 1325 comes into play...

1325 will define whether the trend continues higher, and follows the monthly cycles towards new highs

or

whether the trend again moves into another 3-month cycle that consolidates ‘sideways’ until the start of the next Quarter using the levels shown above.

S&P (e-mini ) 25th JUNE 2011 WEEKLY

if the S&P 500 rises upwards from the June lows @ 1259, then the 3rd quarterly 50% level will come into play.

However, traders should always be aware that 3rd Monthly 50% level rejection patterns can often extend downward towards the following monthly lows in the next Quarter.


Previous Weekly report


S&P Weekly cycles


As noted in the Previous Weekly report, the June lows @ 1259 will try and support the market, whilst the June 50% level rejection pattern will try and push the trend lower towards the July lows.


Therefore, next week could remain within the Weekly levels once again, and swing as high as the Weekly highs....


or it's going to break support and continue to trend lower, as shown in the next chart.


S&P Monthly and Secondary cycles


S&P is currently being supported at the 2nd Quarterly levels, which will shift at the start of July.


Therefore, there is enough reason why the S&P could rise upwards in the last week of the 2nd Quarter.


However, with QE2 ending and no sign of QE3 starting, the S&P could also follow the 3rd monthly rejection pattern towards the July lows.


In conclusion:- if the S&P rises upwards, then the 3rd Quarterly high around 1325 will probably form resistance and push the market lower once again.


If it's trading below current support and the 3rd quarterly 50% level, it's likely to continue down towards 1208.50.


The 3rd Quarter looks to be more sideways range trading with a downward bias.


S&P (e-mini ) 18th JUNE 2011 WEEKLY

next week's lows @ 1254 match the June lows @ 1259, and this will be seen as a support level

If looking for lows in the market for short-term counter-trend moves, then next week's levels come into play, along with using the 5-day range to help validate entry levels...

Random resistance @ 1285.25


Previous Weekly report


S&P Weekly Cycles


S&P moved down into the Support levels @ 1254-59, and then remained range bound within the Weekly levels, with 1285.25 acting as resistance.

As noted in last week's report, if the S&P is going to find support, it will begin to gradually rise over the next couple of weeks, helped by price remaining above 1268.50

However, traders should always be aware that 3rd Monthly 50% level rejection patterns can often extend downward into following monthly lows in the next Quarter.

S&P Primary cycles

In 2010 the Market reversed down from the Primary highs and moved down into the trailing Quarterly 50% levels.

The price action in 2011 is following a similar pattern, but without the 'flash crash' that occurred last year.

And if the market follows a similar pattern, and the trend continues to extend downward, then lower Quarterly 50% levels come into play once again @ 1173-1188

Note:- if the S&P 500 rises upwards from this week's lows @ 1254-59, then the 3rd quarterly 50% level will come into play (Yellow)....

And will define whether the trend continues upwards (QE3)....

or moves down into 1173

S&P (e-mini ) 11th JUNE 2011 WEEKLY

"next week’s trading is simply based on trading either side of 1301.50

If below it’s down towards the June lows @ 1259. (random support Weekly lows @ 1286)"


S&P 500 WEEKLY CYCLES

The S&P has continued down towards the June lows @ 1259, whilst finding some support earlier this week around the Weekly lows @ 1286.

As we can see, next week's lows @ 1254 match the June lows @ 1259, and this will be seen as a support level, but won't be the low in the current downward trend.

That low is likely to extend towards the July lows, that haven't been confirmed as yet.

Depending on how the next few weeks trades, that low could be as low as 1188 (Quarterly 50% level), or 1173 (Yearly 50% level)....

However, if the June lows @ 1254-59 provides support for the next 3-weeks, then the July lows will be higher.

If looking for lows in the market to re-enter longs on 'stock positions' I would wait until July.

If looking for lows in the market for short-term counter-trend moves, then next week's levels come into play, along with using the 5-day range to help validate entry levels...

Random resistance @ 1285.25

S&P (e-mini ) 4th June 2011 Weekly

If the S&P is going to continue upwards, then it's going to rise from the Weekly 50% level and move towards the Weekly level @ 1348. If that happens then we look for short-term weakness that is going to retest the June 50% level @ 1322 from Wednesday

The June 50% level will be the trend guide for the rest of the Quarter.

The S&P continues to trade above 1301, and unless there is a close below 1301, then the upward trend remains stable.

Previous Weekly report

S&P 500 Weekly

The S&P rose upwards from the Weekly 50% level until the Weekly highs, and as noted in the previous Weekly report, a reversal pattern occurred from Wednesday to move back down to test the June 50% level.

However, Wednesday continued lower closing below the June 50% level @ 1322.50, which put pressure on the market for the rest of the week. And as we can see, this has resulted in a Weekly close below 1301


The Weekly close below 1301 helps validated potential further weakness during the current Quarter, which can lead to a trend bias towards the June lows @ 1259

Therefore, next week’s trading is simply based on trading either side of 1301.50

If below it’s down towards the June lows @ 1259. (random support Weekly lows @ 1286)

If above 1301.50 then it’s looks like a 2-day counter-trend move to retest the June 50% level @ 1322.50, which is seen as resistance.

S&P (e-mini ) 28th MAY 2011 Weekly

We saw a similar patterns in March & April, and on both occasions Friday had closed above the Weekly 50% level, and the trend continued upwards...

However, this week failed to close above the Weekly 50% level, to help validate the same pattern.

Based on the current price action, the S&P could be following a double Weekly low pattern into next week's lows @ 1311, as the market consolidates into the start of June.

Previous Weekly report

S&P Weekly

The S&P moved down into a double Weekly low @ 1311, providing another FAKE break pattern.

If the S&P is going to continue upwards, then it's going to rise from the Weekly 50% level and move towards the Weekly level @ 1348. If that happens then we look for any short-term weakness that is going to retest the June 50% level (support)

Note:- Friday's failure to move above the daily highs on Friday could actually see the first 2-days move down into the lower Weekly level @ 1313, which aligns with the start of the month of June....

As we can see the June 50% level is actually a lower level than the MAY 50%, which will then be the trend guide for the rest of the Quarter.

The S&P continues to trade above the 2011 highs @ 1301, and unless there is a monthly close below 1301, then the upward trend remains stable.

Next Week:- simply trade on the side of 1331 until Wednesday, and then the June 50% level.

S&P (e-mini ) 21st April 2011 Weekly

S&P Monthly and Weekly


S&P continues to consolidate above support levels @ 1324.50, after finding support around it's Weekly lows earlier in the Week.


We saw a similar patterns in March & April, and on both occasions Friday had closed above the Weekly 50% level, and the trend continued upwards...


However, this week failed to close above the Weekly 50% level, to help validate the same pattern.


Based on the current price action, the S&P could be following a double Weekly low pattern into next week's lows @ 1311, as the market consolidates into the start of June.


S&P (e-mini ) 14th MAY 2011 Weekly

Remains consolidating above 1324.50 for the next few weeks until the start of June, and then makes a play for the monthly highs


or breaks support and continues lower

Previous Weekly report

S&P Monthly and Weekly

The S&P continues to consolidate above support levels during the month of MAY, and once again we see a familiar pattern appear.

A lot of trends often continue higher when the Weekly lows catch up with the trend, and as we can see, those weekly lows have once again moved upwards to align with support levels in the S&P500 (1324.50)

We saw this in March (fake break)and the trend continue higher in April, and whilst the S&P remains above 1324.50 there is an upward bias towards the MAY highs:- 1383 to 1397

However, we must acknowledge that a daily close below 1320 will put pressure on the S&P to move down into 1300

And anything below 1300, is seen as extremely weak, as it will be once again trading below the Yearly highs

S&P (e-mini) 7th MAY 2011 Weekly

S&P Monthly and Weekly

As per last Week's report, the initial view was that there would be a 2-day reversal pattern back down into 1347, which will then be the guide on whether the trend continues down into the MAY 50% level or not.

I also pointed out in last week's report...

At this stage QE2 remains until the end of June, therefore it's likely to underpin the current trend...


therefore, unless it  is  trading below the Weekly and monthly 50% level @ 1324.50, the trend bias remains stable.

In 2010 we saw a 'flash crash' pattern in the first week or MAY, and in 2011 we have weakness once again in the first week of MAY, however, this time it continues to remain above support levels, helped by the market being above the Yearly highs in 2011 (1301-1331)


There are two possible patterns that can play out for the rest of the month....
 
#1) Remains consolidating above 1324.50 for the next few weeks until the start of June, and then makes a play for the monthly highs
 
#2) the trend continues down using the Weekly 50% level as the trend guide, and follows the Weekly range towards lower lows:- 1310.75 and then 1291.25


S&P (e-mini ) 30th April 2011 Weekly

S&P Monthly and Weekly

Once price began trading above 1337, the trend bias was to continue up into the April highs, and is now likely to continue up towards next week's  highs, & also the highs in MAY...

There are two possible pattern early next week....

#1) next week starts with a 2-day reversal pattern (remains below 1365), and retests  last week's breakout @ 1343-36, and then continues upwards from Wednesday towards this week's highs

#2) the trend continues up towards the Weekly highs by Monday, which is then seen as resistance...

if Monday hits 1375.50 and stalls, then I'll once again look for a reversal pattern back down into 1343-1346.

Trend guide & Random support 1343-1346

At this stage QE2 remains until the end of June, therefore it's likely to underpin the current trend...

therefore, unless it breaks out of the 5-day lows, and is also trading below the Weekly and monthly 50% level @ 1324.50, the trend bias remains stable.  

S&P (e-mini ) 23rd April 2011 Weekly

Because of the shift in the Weekly lows, there is now greater chance of a larger reversal pattern towards lower Support levels @ 1247-57, if there is a daily close below those Weekly lows @ 1299


Previous Weekly report

S&P500 Primary and Weekly

Last week began with a Sell off from the Weekly 50% level and a daily close below support levels and the Weekly lows @ 1299.

As noted in the previous weekly report, this pattern would normally have set up more weakness for a reversal pattern towards lower support levels in April @ 1247-57.

However, the following day followed a ‘fake-break’ pattern, which then rallied back towards the Weekly highs.

                                              As we can see in the Primary cycle…(left chart)

The S&P 500 is once again trading around the upper Yearly level @ 1331, which has formed resistance during the months of February, March, & currently in April

The S&P may remain below this level, and once again try for another breakout pattern below the weekly lows for a move towards trailing support levels, as QE2 comes to an end

or last week’s price action and fake break pattern sees the trend continue towards the monthly highs in April & then MAY @ 1356-1365.

S&P (e-mini ) 16th April 2011 Weekly

I favour the initial move down and back towards the monthly 50% level in April.

That 50% level around 1304-1305 is a critical support level...


Previous Weekly report


S&P Monthly and Weekly

Selling pressure earlier this week with a change in the Weekly dynamic levels from 1322 to 1330.50

However, the S&P continues to remain above support, and based on the Weekly levels likely to push upwards in the short-term using the Weekly 50% @ 1319.50 as a trend guide.

The market continues to consolidate between the Yearly highs @ 1300-1331, and we can also see the Weekly lows have now caught up with the current Support levels.

AAt this stage I haven't factored in the S&P moving down into the lower 2nd Quarter support levels @ 1246-54.....(Previous weekly report)

Because of the shift in the Weekly lows, there is now greater chance of a larger reversal pattern towards lower Support levels @ 1247-57, if there is a daily close below those Weekly lows @ 1299

In conclusion:- trade on the side of the Weekly 50% level in the short-term