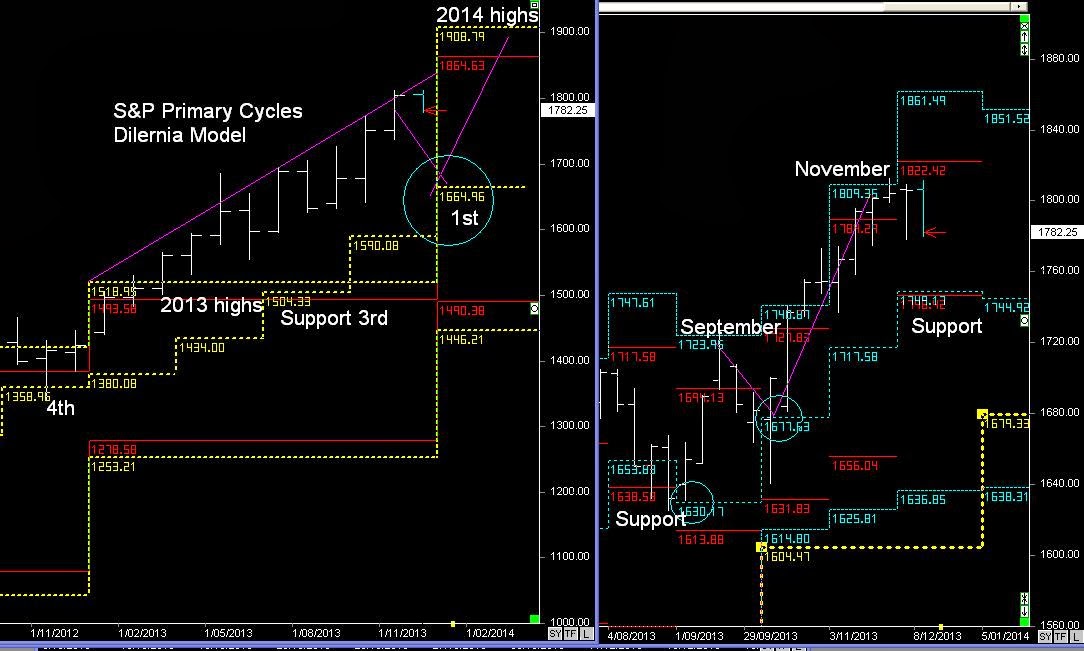
Primary & Monthly cycles
The S&P didn't precisely hit the support level @1749, but it nevertheless continues to follow the Primary Break-n-Extend pattern towards the 2014 highs, as part of Dilernia Principle from the 2013 highs.
For those trading the Primary trend, especially on Margin, I would begin to offload long positions around the 2014 highs/ January highs in the new year.
And then look for the forward trailing support levels within each Quarterly timeframe to move back in.