S&P 500 E-mini futures 28th January 2012 Weekly Report

The S&P is about to hit the January highs @ 1314, as part of the extension pattern from the December 50% level :- This Monthly high is seen as resistance level.

However, there is also the single monthly breakout @ 1278 (RED), which could result in the price action extending up towards the new February highs, as part of a 2-month wave pattern during the 1st quarter.


S&P Weekly cycles

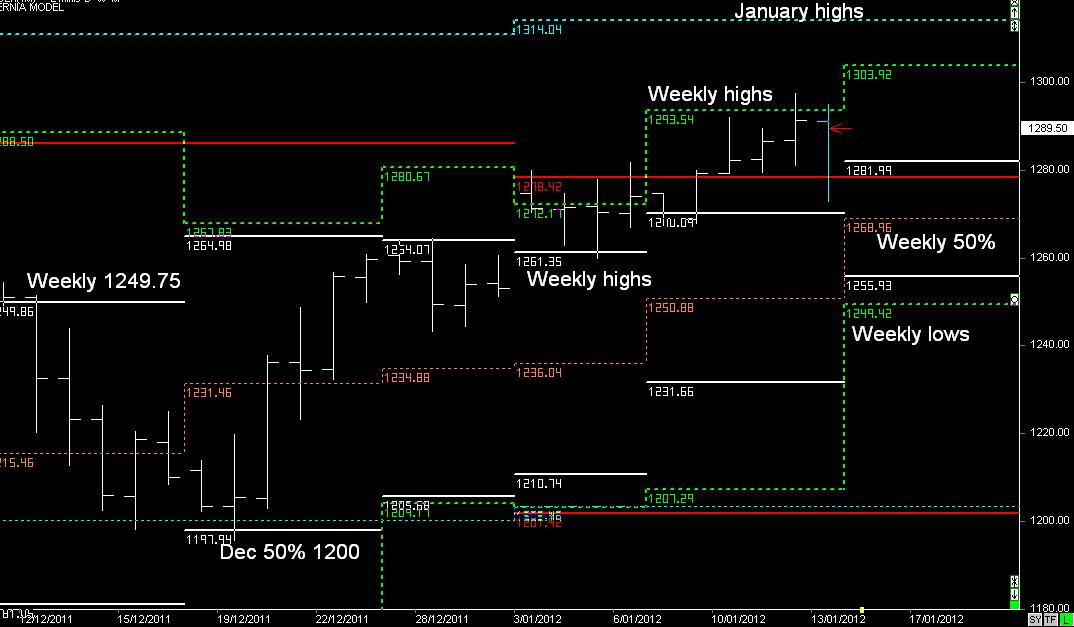
S&P is currently trading around the January highs @ 1314.

These resistance levels will disappear in  two days time, and extend up towards the February highs. (potential 2-month wave pattern during the first quarter.

In the short-term, the focus should be trading the current break out pattern from 1278.


 The completion of the Break and Extend pattern is around 1235.


Trend guide on whether price moves up or down in the first 2-3 days will be determined by the Weekly level @ 1314

S&P 500 E-mini 21st January 2012 Weekly Report

S&P Weekly and Daily cycles


The S&P is about to hit the January highs @ 1314, as part of the extension pattern from the December 50% level


These Monthly highs are seen as resistance levels that could result in the last week of this month (next week) begin a reversal pattern back down towards the Weekly 50% level & 1278 (5-day reversal pattern).

However, there is also the single monthly breakout @ 1278 (RED), which could result in the price action extending upwards towards the new February highs, as part of a 2-month wave pattern during the 1st quarter.

These 2-month wave patterns are described in the Book. That means the S&P moving as high as 1340.

Next Week:- The Short-term trend will be defined by next Week’s levels, whilst using sets-ups in the 5-day daily cycle range.

S&P 500 E-mini 14th January 2012 Weekly report

Primary range remains Bullish, as per previous Weekly Report.

We have a December 50% level support pattern, which often suggests an extension upwards in the current month:- Target January highs @ 1314.

If the market follows the Weekly cycles upwards, then it might take a number of weeks to reach its target, as long as it remains above 1270...
Previous Weekly report


S&P Weekly cycles

The previous 5-days has continued to follow the dynamic Weekly cycles remaining above 1270, as part of a move towards the January highs.

The upward trend is based on the higher timeframe December 50% level support pattern and extension towards the January highs @ 1314, whilst the Weekly highs act as random resistance zones. (8.5 to 14 points)

Same pattern for next week:- trend bias is to continue higher...

as long as it's above 1278-82.

Trailing support level is the Weekly 50% level @ 1269

Anything below the Weekly lows @ 1249, puts the current upward trend at RISK.

S&P 500 E-mini futures 7th January 2012

S&P Weekly Cycles

Primary range remains Bullish, as per previous Weekly Report.

We have a December 50% level support pattern, which often suggests an extension upwards in the current month.

Target January highs @ 1314.

If the market follows the Weekly cycles upwards, then it might take a number of weeks to reach its target.

As long as it remains above 1270