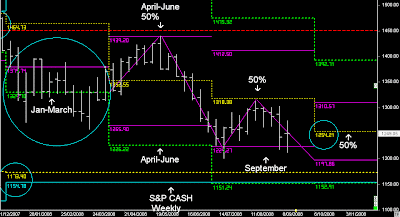
If the trend is going to continue down, it wouldn't surprise me to see a re-test of September 50% level in the Week of contract expiry and then for price to continue lower"
Previous Weekly Report
 DOW S&P Weekly charts
US markets tested their September levels early in the Week and were pushed lower.
This Week is contract expiry which often can see higher prices, but I can't see higher prices in US markets based on Market dynamics during this month.
I still see more sideways prices action with hopefully lower prices in this Quarter.
 S&P Daily
This Week US markets gaped open higher based on the news that the FED was bailing out Freddie & Fannie, but that didn't last long.
US markets were pushed back down into their Weekly lows:- Monthly 50% rejection.
 S&P 5-day pattern
As pointed out in the Premium report :- look for 2-day set-ups using the yellow channels within the Weekly timeframe.
Trade the break on Tuesday down into the lows. Use Wednesday's 50% level to trade down again.
Thursday:- was simply trade either side of the Yellow filter, as after a 2-day pattern extension the 3rd day doesn't have a probability on direction.
As pointed out....if Friday was going to move higher then price would come down into support and bounce closing higher.
 S&P Weekly CASH
Therefore more sideways action this quarter, with hopefully a push down into 1158-73.
Whether it gets to 1158-73 in 2008 or not, this is the level that I will feel highly confident in that the 2008 lows have been set and US markets can begin a 3-month upswing to close out 2008.
Otherwise it's more sideways price action until then....But if prices are trading above the forward 50% level in the new Quarter (October) then the bias is to continue higher in Monthly step formation over the 3-month period.
- Daily Trading Set-ups & Analysis

