S&P (e-mini ) 1st January 2011 Weekly

S&P Primary Cycle

The end of the 2010 Primary cycle, and we begin a new Primary cycle for 2011.


Trading above the 2010 highs @ 1200 should continue to push up towards the 2011 highs @ 1300

a number of resistance levels in 2011 :- 1300 & then 1331.

The Primary cycle is a long time, therefore we continue to focus on the lesser timeframes (Monthly and Weekly), whilst looking for trading set-ups using the 5-day range and the Weekly levels.

We also need to be aware of any 'flash crashes' that may occur in 2011....

with the key support level @ 1173 (2011 50%)


S&P monthly and Weekly

My view was for the S&P to continue higher in the first Quarter for 2011, with the most robust setting using the 3 week lows as support (late December or early January)

In the short-term, the trend remains up, as long as price remains above the Weekly level @ 1253.50

If below, there is still the possibility that price moves down and finds support at those 3-week lows @ 1232-1234

My preferred pattern would be price coming down into those lows first before the January highs have been reached @ 1280

If the January highs @ 1280 are reached first without moving down into the Weekly lows, then the support levels will differ later in the January, as they won't be as valid.

S&P (e-mini ) 25th DEC 2010 Weekly

My view is that the S&P will complete the break and extend pattern from the October highs @ 1174 and into the December highs 1249-1252, and then go looking for the weekly lows later in December or early January.

Previous Weekly report

S&P Monthly and Weekly Range:- Dilernia Model

We can see the S&P reach the December highs and likely continue towards the January highs in the first Quarter of 2011.

However, the ideal pattern to capture the continuation of the UP trend would be to see the S&P revisit the weekly lows, which have now crept upwards and are currently @ 1222

The DOW will mimic the same patterns as the S&P, but it hasn't reached those same December highs @ 11593, therefore we have the S&P consolidating around the highs waiting for the DOW to complete the same pattern.

Therefore the trend in the S&P can continue up towards next week's highs...

and if the S&P is going to move down into the Weekly lows, then the first sign will be a daily close below 1248.

S&P (e-mini ) 18th DEC 2010 Weekly

S&P Monthly and Weekly (Dilernia Model)

S&P moved into an extremely tight trading range over the past week, as it looks to be grinding to a halt as we get closer to the holiday season with a lack volatility

My view is that the S&P will try and complete 1249.50 next week (1252) and then go looking for the 3-week lows later in December or early January.


Whether the market continues up or goes down... the trend guide over the next 5-days will be determined by the Weekly level @ 1239.50


If price moves down from 1239.50 on Monday, then my view is over the next 5-days it will be more of the same, as the market drifts towards the Weekly 50% levels.

S&P (e-mini ) 11th December 2010 Weekly

upper targets are likely to be reached next week :- 1238 to 1249.

December highs @ 1249 will complete the break and extend pattern from October's breakout @ 1174


Previous Weekly report


S&P Monthly and Weekly


1249 is likely to be reached by new week. (1252)

Once that completes I'll be looking for a potential reversal back towards the 3-week lows.

However, there needs to be lesser patterns that will verify that expectation...

for example:- a breakout of the 5-day lows

S&P (e-mini ) 4th DEC 2010 Weekly

The most likely outcome is the S&P continuing to consolidate over the new few days until the start of December.

If the S&P is going to continue upwards, then the most robust support level will be the levels in December and a push up towards higher highs.


Previous Weekly report


S&P Montlhy and Weekly

There is a breakout of the October highs @ 1174, which resulted in the S&P finding support around that level for a number of week's during November.

And on the first day of December the market begins the next leg up towards the December highs.

Those upper targets are likely to be reached next week :- 1238 to 1249.

December highs @ 1249 will complete the break and extend pattern from October's breakout @ 1174

S&P (e-mini ) 27th November 2010 Weekly

The S&P has remained within the weekly levels and continues to trade above 1182, which is the critical trend guide for the 4th Quarter.

However, in the short-term the S&P 500 can continue to consolidate between the Weekly levels until the start of December.


Previous Weekly Report

S&P 500 (Futures)

S&P continues to consolidate around 1182 in the 4th Quarter and remain within the Weekly levels.

There is a Dilernia Drop in the forward monthly timeframe, therefore there is a bias to continue lower in the current month, which may move down towards the November levels @ 1161.25

However, the most likely outcome is the S&P continuing to consolidate over the new few days until the start of December.

If the S&P is going to continue upwards, then the most robust support level will be the levels in December and a push up towards higher highs in the first quarter

Bearish pattern would be anything below the December 50% levels, as the market would be rotating back towards the 2011 Yearly 50% levels (Primary cycle)

S&P (e-mini ) 20th November 2010 Weekly

S&P 500 Monthly and Weekly

We saw early selling come into the market this week, as price moved down and retested last months breakout of the October highs @ 1175 

The S&P has remained within the weekly levels and continues to trade above 1182, which is the critical trend guide for the 4th Quarter.

Whilst the market remains above 1182 the trend bias is up towards 1255...

However, in the short-term the S&P 500 can continue to consolidate between the Weekly levels until the start of December.

S&P (e-mini ) 13th November 2010 Weekly

S&P is likely to continue up towards 1255.

However, it might take a number of weeks to get to that level, as I believe the market will move back and trade once again within the Weekly ranges :- Orderly patterns.


Previous Weekly report


S&P Monthly and Weekly range

S&P has moved once again within the Weekly ranges (orderly patterns) and looks to be moving back towards the major support levels around 1182.

Higher Weekly open and trading below 1217.50 put pressure on the S&P to move towards a lower Weekly close, also helped by the Dilernia Drop in the forward Weekly timeframe (the trader trading book)

If the trend in the S&P 500 is going to continue towards 1255, then 1182 needs to hold support over the coming week or so

In the short-term (next week) we use the weekly levels in deciding which direction the market will go
Next week begins a new week from a lower Weekly open and around the Weekly 50% level, which can see the trend swing back towards the highs...

or drift down towards the Weekly lows:- support

S&P (e-mini ) 6th November 2010 Weekly


S&P 500

S&P has followed the November dynamics helped by a breakout of the weekly highs on the same day as the Fed announces the printing of $600 Billion to stimulate the economy.

S&P is likely to continue up towards 1255.

However, it might take a number of week to get to that level, as I believe the market will move back and trade once again within the Weekly ranges :- Orderly patterns.

That means that in the short term the market can continue towards next week's highs

But it can also mean that next week begins with a minor reversal pattern to retest the Weekly breakout & 1201.25.

Trend guide 1217.50

Major on the S&P is now 1182

S&P (e-mini ) 29th October 2010 Weekly

S&P 500

S&P continues to hit resistance around the October highs, but failing to reverse down towards trailing support levels.

Those October highs (resistance) have now shifted and dynamically moved higher during November. (next Week)

The trend guide will be simply be defined by 1182-1187 and next week's levels.

My preferred pattern continues to be a minor reversal down into support levels (Weekly lows) before the trend has the potential to move upwards.

If the trend is going to continue higher, then the weekly lows need to hold support using a lower 'Friday' close pattern.


S&P (e-mini ) 23rd October 2010 Weekly

S&P Monthly and Weekly

1182 continues to form a major resistance zone, as seen earlier this week with Monday and Tuesday selling down...

However, the Weekly levels continue to support the market.

And even though I think the market is trying to push down towards the November 50% levels...

It can just simply continue upwards and follow the Weekly trend next week towards the highs @ 1194+

Trend guide 1177

S&P 500 (e-mini ) 16th October 2010 Weekly

Market dynamics suggests more gains next week towards  Monthly highs, using the Weekly levels (white) as a trend guide @ 1154.

If or when the S&P 500 reaches 1182, my opinion it will lose steam and begin to unwind later in the month back towards the Monthly 50% levels in November ....


Previous weekly Report


S&P Monthly and Weekly

1154 sent the S&P up into resistance levels in the 4th quarter @ 1182

My view is that the S&P is starting to lose steam around these highs, but to help verify weakness price needs to be trading below 1166 next week, along with a possible Wednesday 'sell' pattern.

S&P (e-mini ) 9th October 2010 Weekly


S&P Monthly and Weekly

Early sell pattern down into the Weekly 50% level, and as per Weekly report this week has followed Set-up B as price has moved up from 1143.50 to 1165…

Market dynamics suggests more gains next week towards the Weekly and Monthly highs, using the Weekly levels (white) as a trend guide @ 1154.

If or when the S&P 500 reaches 1182, my opinion it will lose steam and begin to unwind later in the month back towards the Monthly 50% levels in November

S&P (e-mini ) 2nd October 2010 Weekly


S&P Monthly and Weekly

3rd Quarter closes with price trading around the September highs @ 1142

4th Quarter target is 1174 to 1182.

My preferred pattern is to have the S&P move lower over the next 2-weeks down into the October 50% level and then continue higher.

Weekly trend guide 1143.50

first Weekly lows will form support levels @ 1111-17 and then drift lower (2nd week)

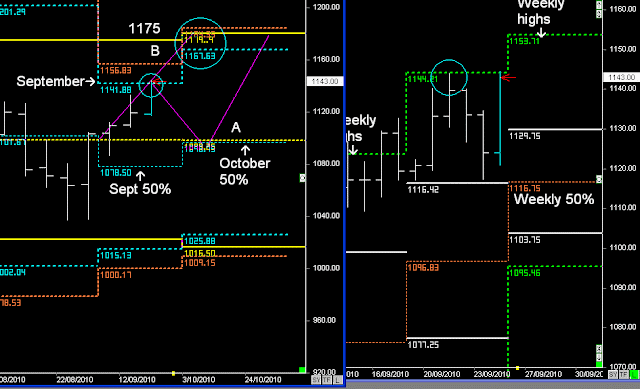
SET-UP A, as described in the previous weekly report

SET-UP B, is the trend moving upwards from 1143.50 towards 1165 early next week

S&P (e-mini ) 25th September 2010 Weekly

S&P Monthly and Weekly

Whilst above 1098.50 the trend bias is upwards during September, and this week has seen the market continue up into September’s highs, stall, drift back down and then swing back towards the Weekly highs on Friday.

There are two possible patterns based on the Quarterly target @ 1175-79.

Set-UP A: - Hits the September highs @ 1142-1144 and reverses down towards the October 50% level, and the trend then continues upwards in the 4th Quarter:- first target 1179


If Set-up A occurs then there is more probability that the trend can continue to rise upwards for the rest of 2010 :- 2 to 3 month up trend:- steady up trend


SET-UP B: - Doesn’t reverse down but continues to hit minor resistance levels @ 1142 & 1158, but then completes the move into 1179 in early October:- next 2 -weeks.

If this pattern occurs then there is more probability that price will reverse back down at the start of the 4th Quarter:- larger trend reversal and volatility

This is same pattern that occurred in January and April this year.


My preferred pattern is SET-UP A occurring, but after Friday's price action that might not be the case.

SET-UP A could be be verified by a Wednesday 'sell' pattern and price trading below 1129.75


S&P (e-mini ) 18th September 2010 Weekly

S&P Weekly

This week's expectation was for the trend to continue up into resistance levels based on the Weekly and Monthly highs.

Friday's reversal pattern has an expectation of further weakness early next week:-  2-day reversal

If price is below 1116, then the trend bias is down towards 1097.

Around 1098.50 remains a major trend guide for the 3rd Quarter.

Below 1097, and price is revisiting 1078.50 (September 50% level)

My view is that the S&P will move into a consolidating pattern until the start of the 4th Quarter. (drifting lower)

Note:- A 2-day reversal pattern next week could result in a 2-day 'stall' pattern.

If price continues to remain above 1116, then the trend bias is up towards 1141-1144 later in the Week.

S&P (e-mini ) 11th September 201o Weekly

Based on the current price action the trend looks to be moving up towards the September highs @ 1126, with minor resistance around 1115.

Last Week's Report

S&P 500 Weekly

Based on the current price action the market expectation is to continue towards the September highs- 1123- 1126

Those levels will be seen as resistance.

If that's the case we then begin to look for patterns in the 5-day range, and see if there is going to be a possible rotation back down towards the Weekly and monthly 50% levels @ 1078.50 

That will be verified by a 5-day low breakout and price trading below 1098.50- 1099

S&P (e-mini ) 4th September 201o Weekly

September 50% level starting next week is going to be the trend guide for the rest of the 3rd Quarter

Either price swings upwards and moves back towards 1128

or it follows the September 50% level rejection pattern, as part of the continuation of the trend being below 1098.50.


Previous Weekly report


                                                             S&P Weekly

The shift in market dynamics from August to September provided the impetus for the market to rally this week.

At the start of last week my view was to continue lower, especially when price move back below 1056 and started to move lower, as part of the trend being below the 1098.50 during the 3rd Quarter.

However, that changed on Wednesday with the cross over of the September 50% level and a breakout of the 5-day highs on Wednesday on the same day.

A breakout of the 5-day range will normally follow a break and extend pattern upwards on the next day (Thursday) and thereafter  continue into higher highs by Friday to 1098.50  to 1102

Based on the current price action the S&P and friday's close,  the trend looks to be moving up towards the September highs @ 1126, with minor resistance around 1115.

S&P (e-mini ) 28th August 2010 Weekly

S&P Monthly and Weekly

Weekly lows provided support and price is now rotating back towards the September 50% level.

That level starting next week is going to be the trend guide for the rest of the 3rd Quarter

Either price swings upwards and moves back towards 1128

or it follows the September 50% level rejection pattern, as part of the continuation of the trend being below 1098.50.

If that's the case the move down is towards 970, ( with a possible spike down into 938).

However, around 970 is an ideal level to be moving back into stocks for the rest of 2010, as it is the Yearly 50% level, which is the same level that has supported the Australian market for the past few months

What we need to keep an eye on next week, is the 50%  level @ 1079 and how price responds to it.

If the market moves upwards and then breaks below 1056 from Wednesday, then we begin to look for the down trend to continue during September


S&P (e-mini ) 21st August 2010 Weekly

S&P monthly and Weekly Ranges.

Early rise upwards this week resulted in 1098.50 providing a robust resistance level, and as pointed out in the Premium Report on Thursday...

Once price drops below 1084.75 the trend bias was to move back down into the Weekly lows:- lower Weekly close by Friday

At this stage I favour more weakness, with a trend bias down towards 1022 during the 3rd quarter...

However, based on Friday's lows there is a potential 2-day counter-trend to begin next week

Next week's 5-day trend guide will be based on 1077.50, along with the levels in the 5-day range whilst trading 8.5 to 14 point spiral points for day traders.


S&P (e-mini ) 14th August 2010 Weekly


S&P Monthly and Weekly

Last week’s view was to continue higher based on the same pattern of rising up from Friday’s lows:- as long as the market remained above 1116.

As pointed out in the Premium Report on Wednesday....

Tuesdays' close below the daily 50% level and below 1116, the trend bias is to move lower.


The changed of trend began with Tuesday’s reversal bar and daily close below 1116 , and the verified by the breakout of the 5-day lows on Wednesday @ 1102 and a continuation down into the medium term support level @ 1078.

Current price action suggests more weakness whilst below 1085...

Because price is below the monthly 50% levels in August the trend bias is to continue down, but that will need to be verified with a breakout of the Weekly lows @ 1063...and a continuation of 3rd quarter weakness

Otherwise above 1085 can move into another 5-day consolidating pattern between 1098.50 and the Weekly lows, and the market remains in a sideways pattern for the next couple of weeks.

S&P (e-mini ) 7th August 2010 Weekly


S&P Monthly and Weekly

Whilst the Trend is a above 1099 the bias is to rise upwards during August.

Trend target is 1155.

However, this is likely to follow the Weekly pattern formations over the next 2-weeks.

Similar 5-day pattern as last week, and with Friday's low providing support, the trend should continue towards 1137 this week.

As long as it remains above 1116

S&P (e-mini ) 31st July 2010 Weekly


S&P Monthly and Weekly

This week has seen the Market reach the Weekly highs @ 1117 and reverse back down into support levels.

Based on current patterns and the price action on Friday, my view is
for the S&P to continue towards next week's highs.

Friday's low normally sets up a continuation trend upwards over the next
2-3 days

Those up moves will be defined by price remaining above 1106

S&P (e-mini ) 24th July 2010 Weekly

S&P Monthly and Weekly

As per last week's report....

Either the trend was going to continue down from 1099 or it was going to remain within the Weekly ranges until the end of July...

With Friday's close above 1099 it now looks like the market is following the Weekly ranges up towards next week's highs.

Trend guide for next week is 1099.

S&P (e-mini ) 17th July 2010 Weekly

S&P Monthly and Weekly

As per previous Report, my view was that 1099 would stall the UP trend (resistance), and that the 3rd Quarter would begin to move down towards the monthly lows and towards 969.

There are two possible patterns.....

This month continues to trend downwards and into the July lows

or

The market consolidates between the Weekly levels until the end of July, with a bias towards 969 in the 3rd Quarter.

S&P (e-mini ) 10th July 2010 Weekly

S&P Weekly

"Drive down into June's lows has the July lows pushing lower, with the likely target 969 (Yearly 50%). Support will need to be verified with a 5-day high breakout & above the Weekly 50% level for a swing back towards the monthly 50% levels @ 1099...... Previous Weekly Report

Expectation that Price would continue down into July's lows failed to materialise, but the price action to verify the reversal pattern played out....

5-day high breakout (white).... and price is trading above the Weekly 50% level with the trend swinging back towards the monthly 50% levels July

Next Week's trend guide is the Weekly 50% level.

S&P monthly

The pattern for the most robust swing trade was to see the market move down into July's lows and then continue towards 1099...


Based on the current market dynamics I'm treating this Quarter as a sideways 3-month pattern between 1099 and the Monthly lows.

S&P (e-mini ) 3rd July 2010 Weekly

DOW Yearly and S&P monthly

Expectation that the DOW is moving back towards 9124, (Yearly 50% level) which will be seen as support in 2010, but will need to be verified with a 5-day high breakout thereafter and a swing back towards the 3-month 50% levels.

S&P 500:- Drive down into June's lows has the July lows pushing lower, with the likely target 969 (Yearly 50%)


Once again support will need to be verified with a 5-day high breakout (above the 3-Week 50% level for a swing back towards the 3-month 50% levels @ 1099.

And likely consolidation for the rest of the Quarter.

S&P (e-mini ) 26th June 2010 Daily recap

S&P Monthly & Weekly

Last week's reversal down from the highs and failure of the Weekly 50% level is now setting up the S&P to continue down into the 3rd Quarter lows. (July)

The UP trend was dependant on the weekly 50% level holding, but the 5-day low breakout on Tuesday gave us clues that wasn't going to happen.

Currently the 2nd Quarter 50% level (yellow) is supporting the S&P, but with the shift in the 3rd Quarter 50% the move is likely to continue down July towards the 3rd Quarter lows, with a possible move as far as the 969 (Single Year 50% level)

Next Week:- the market can continue to consolidate for the next 5-days until July begins and we use 1109 as resistance, or the Weekly 50% levels can send the S&P lower pushing July's lows closer to 969.

S&P (e-mini ) 19 June 2010 Weekly

S&P Monthly and Weekly

This week has seen the 3-week highs and June 50% level stall the market from rising, but not provide any major selling, and we can now see the Weekly timeframe close above 1106.50.


This has the potential to send the S&P upwards over the next 2-weeks... (July)

Support will be defined by 1105.75 for next week, and likely to follow the Weekly range upwards.

If next week decides to trend upwards then the Weekly highs have less probability to stall the market from Thursday onwards, and the 5-day highs have less probability to provide reversal patterns.


This week's close failed to move to the 5-day highs on Friday, and because of this pattern I don't have the view that next week will begin with a 2-day reversal pattern and move below 1105.75


Next Week is simply going to be defined by the June 50% level and 1105.75.


How far the next 2-weeks rises is random, but whilst above 1105.75 the trend is up until the start of the 3rd Quarter and the start of a new 3-month cycle.

S&P (e-mini ) 12 June 2010 Weekly

S&P Monthly and Weekly

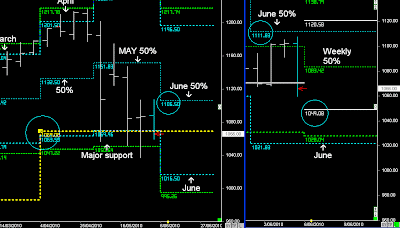
S&P trading around higher timeframe support levels (3-Quarterly 50% levels 1074) but below the June 50% levels.


At this stage I'm treating the S&P as hitting resistance around the 3-Week highs and 3-month 50% levels in June.


Often the 3-week highs and 3-months 50% levels can send the trend back down, or at least keep June consolidating below the June 50% levels @ 1111.50

S&P (e-mini ) 5th June 2010 Weekly

S&P Yearly and Quarterly

As per Previous Weekly report, there is a chance that the S&P continues down towards the Yearly 50% level in the 3rd Quarter.

Friday has closed below the 3-Quarterly 50% level, which is bearish.....

And at this stage, whilst the market remains below the 3-month 50% level the bias is down, but the speed of the move towards 969 is unknown.


S&P Monthly and Weekly

2-month wave pattern completes around the June lows.

If the market was going to 'trend' down into 969 I would have preferred to have seen Friday closed near the June 50% level and then sold off from a higher Weekly open:- trust pattern.

Because of the current patterns we could end up with minor swing patterns (UP) next week, using 1049 as a random support level.

However, the overall trend remains bearish and pushing lower.

S&P500 (e-mini ) 29th MAY 2010 Weekly


S&P Yearly, Quarterly and Monthly

S&P Trading around the 3-Quarterly 50% level and the MAY lows, and I expected a little more upside this week for a move towards the June 50% levels that begin next week.

As explained in last week's report there is a potential 2nd month down move in June from the monthly 50% levels, and some of the biggest sell-offs occur in the last month of the Quarter when price begins from the monthly 50% level.

3d Quarter 'thrust' pattern into the 2009 Yearly 50% level has completed from the March lows.

Any further UP moves would need to align with the 4th Quarter 50% level, and continue up from the 4th quarter 50% level and into the highs, which aligns with the Yearly 2010 highs.

If that happens then price can push back down into the Yearly 50% level in 2010 and consolidate for a number of Quarters during next year and move into a long-term sideways pattern until the 2nd half of 2010"......
Weekly report 15th August 2009


What happens if the S&P follows last year's forecast?

if the S&P 500 follows the same pattern and moves down into the 2010 50% level, that is 100 points lower or 1000 points in the DOW.

In conclusion:- It's too early to get comfortable with current support levels, as there are a couple of lesser timeframes that still have bearish patterns.

Note:- the Weekly timeframe will still remain within the MAY timeframe and won't begin until the week after, which may result in another 5-day sideways pattern

S&P (e-mini ) 22nd MAY 2010 Weekly


S&P Weekly

The past 2 weeks has seen precise text book patterns based on the Weekly low breakout @ 1173 and subsequent price action down into this week's lows @ 1055.

And as per Friday's Daily report....

"If and when those Weekly lows and Friday lows occur I'm expecting a larger swing pattern back towards the June 50% levels"

Therefore our support next week is 1076.25

and the rotation is back towards the Weekly 50% levels.


S&P monthly

Current support is valid during MAY and any rotation is towards the June 50% level.

Once price reaches the June 50% level there is a possible continuation down in the following month

Why?

Whenever there is a Monthly high reversal pattern they usually move in 2-month wave patterns.

Most reversal patterns occur in the previous month and then follow the trend down into the current month, find support and then the trend continues higher once above the monthly 50% level.

This reversal pattern started in MAY therefore June becomes the 2nd month.

Therefore any reversal back towards the June 50% level must be viewed as resistance until proven wrong.

S&P Quarterly and Yearly

The basic premise on the Quarterly and Yearly timeframes is that any subsequent weakness in June or trading below the Quarterly 50% level @ 1074...

and then trend is to continue down towards the Yearly 50% level @ 969 in the 3rd Quarter.

S&P (e-mini ) 15th MAY 2010 Weekly


S&P Monthly

S&P continues to trade below the Monthly 50% level, and at this stage we have an expectation that price is rotating down towards the June lows.

The current 'major' support levels around the 3-quarterly 50% level & MAY lows are extremely robust, and it doesn't necessarily mean that the trend will continue down into a double monthly low but there are a number of patterns in the lesser timeframes that will provide some pre-emptive moves.


S&P Weekly and 5-day pattern

Last week's price action was 'pre-emptive' as it played out as expected.

A number of precise text book patterns over the past 2 weeks.

Previous Week saw a Weekly low breakout and trend spike down into the
MAY lows.

Pre-emptive:- This week saw the 3-day counter-trend move beginning from the
Weekly 50% level and retesting the previous Weekly low breakout and then
a Thursday sell pattern with the expectation of a lower Friday close.

Normally Thursday has a much greater range on the
downside (trading below the monthly 50% levels once again), but Friday’s break verified the downward move into the Weekly 50% level and Friday’s lows"


Next Week:- Friday's 5-day low support can often provide a 2-day reversal pattern upwards using the Weekly 50% level as a guide.

However, I'm not sure that the market will continue much further from Wednesday.

The reason being is that a Weekly breakout (1168-73 previous Week), will often extend down towards the Weekly lows.

Currently that hasn't happened, which means anything below the Weekly 50% level and the bias is to continue towards the Weekly lows either next week or it could take a number of weeks to continue to drift down into the Weekly lows.

DOW S&P 8th MAY 2010 Weekly


DOW S&P Monthly

As mentioned a few weeks ago...(17th April)

"The UP trend won't continue until the start of the next month after revisiting the MAY 50& levels

or

# follows a double monthly low move into major support levels and the Quarterly 50% levels.(Yellow)

Don't discount this, because the US markets will revisit the 3-month lows during the year and it hasn't as yet
. "

Treat US markets as part of a double monthly low pattern into June, using the MAY 50% levels as resistance.

That means, I'm expecting these levels to hold support during MAY, but possibly double dip into lower lows during June.


DOW S&P Weekly


There is a breakout of the weekly lows, which should continue down into the Weekly lows this week.


If that happens then we look for a swing back towards the MAY 50% levels.


Note:- If Monday closes higher but below the Weekly 50% level, I would normally look at this price action as a 'short' trade:- sell resistance and a higher daily open on Tuesday


However, I have also see these exact pattern continue higher and move into a 3-day UP move to retest the previous Weekly lows.

That means that by Wednesday price can be trading above the MAY 50% level, but from Thursday onwards look for a move back down into the lows.

DOW S&P 500 1st MAY 2010 Weekly

DOW S&P Monthly

Break and extend reversal pattern from April highs down into the monthly 50% levels failed to play out. Instead the April highs formed a resistance zone which now disappears and shifts higher in MAY

There is an expectation that price would continue towards the 2nd Quarter highs, but normally that occurs from the Monthly 50% levels in MAY.

Next week both markets align with the Red levels (single monthly 50% level & 3-week 50% level), and it becomes and each way bet on direction.

Whilst below those levels price is moving down into the MAY 50% levels:- and then it might take a few weeks for US markets to find support (3-week consolidation) and then continue upwards in June to complete the 2nd Quarter highs.

Or next week's continues upwards, as the April high resistance levels disappear and the MAY highs align with the 2nd Quarter highs in the S&P @ 1230.75

Daily report out on Monday

DOW S&P 24th April 2010 Weekly


DOW S&P Monthly

Double top high in the 2nd quarter has failed to materialise with Friday's close above the April highs in the DOW.

There is still 1 week to go until MAY begins, but at this stage the target of 1230 in the 2nd quarter for the S&P 500 is going to be reached much quicker than I expected.


DOW S&P Weekly

The entire double top scenario played out accordingly until Wednesday's failure to continue down into the 5-day lows, and with Friday's close above the 5-day highs this is likely going to push the Markets upwards on Monday.

Based on the Weekly timeframe & range, it might take another 2-weeks until 1230 is reached as price remains within the 5-day range.

There is still a slight chance that the 3-week lows are tested before 1230 is reached, but price would need to be trading below the weekly 50% level.

Daily report out on Monday.

DOW S&P 17th April 2010 Weekly

DOW S&P Monthly

2nd Quarter target in the S&P is 1230 and we can see the MAY highs are now aligning with the upper target.

However, we are now trading the completion of the break and extend pattern during this quarter and the expectation that price is moving back towards the 3-month 50% levels.

The most robust set-up for a continuation of the down trend is a double top on the DOW early next week @ 11082...

And the holding pattern is until the start of MAY.

The UP trend won't continue until the start of the next month.

There are three possible patterns....

A. moves down into the MAY 50% level and then continues higher, as per 4th Quarter in 2009

B. moves down into the April 50% level and then consolidates for a couple of weeks below and then continues back towards the highs, as per first Quarter in 2010.

C. follows a double monthly low move into major support levels and the 3-Quarterly 50% level.

Don't discount #3, because the US markets will revisit the 3-month lows during the year and it hasn't as yet. We saw a similiar pattern in the Aussie market in the first Quarter.


Therefore:- depending on the how many contracts traded the bias is to hold into the the first target @ 1139 and then into the close of the month.

If there is a breakout of the 3-week lows next week, then there should be another 'short' set-up using the 3-Week 50% level the week after.

DOW S&P 10th April 2010 Weekly

DOW and S&P Monthly

Break and extend patterns from March continuing towards April's highs.

These break and extend patterns have provided reversal patterns in each Quarter:- October's highs & January's highs, and I'll be looking for the same patterns around April's highs

2nd Quarter target @ 1130 in the S&P, but in the short-term around April's highs I will look for reversal patterns once again back towards the Monthly 50% levels.

Break and extend will complete, and once again it will depend on how much 'lag' time there is in the DOW, as it seems the S&P will reach 1201 earlier.

DOW S&P Weekly

Expected resistance around the Weekly highs played out on the S&P, but not in the DOW.

And the lag time provided friday's rally into higher highs and likely to continue upwards early next week.

DOW S&P 3rd April 2010 Weekly

S&P Monthly

2nd Quarter target @ 1230

Along the way we are trading the intermeditate patterns within the Monthly timeframe and the lesser patterns within the Weekly timeframes.

DOW S&P Weekly


Next Week's highs are viewed as resistance in an UP trend.


Any rotations down will be verified using the patterns in the 5-day range.

Any larger rotations down will need to see the Weekly 50% levels fail to hold.

Support:- April 50% levels and 3-week lows