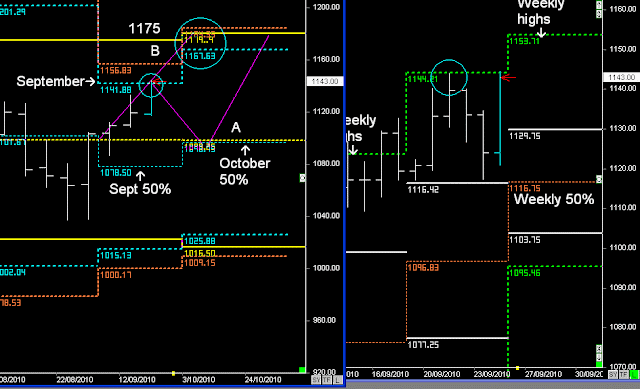
S&P Monthly and Weekly
Whilst above 1098.50 the trend bias is upwards during September, and this week has seen the market continue up into September’s highs, stall, drift back down and then swing back towards the Weekly highs on Friday.
There are two possible patterns based on the Quarterly target @ 1175-79.
Set-UP A: - Hits the September highs @ 1142-1144 and reverses down towards the October 50% level, and the trend then continues upwards in the 4th Quarter:- first target 1179
If Set-up A occurs then there is more probability that the trend can continue to rise upwards for the rest of 2010 :- 2 to 3 month up trend:- steady up trend
SET-UP B: - Doesn’t reverse down but continues to hit minor resistance levels @ 1142 & 1158, but then completes the move into 1179 in early October:- next 2 -weeks.
If this pattern occurs then there is more probability that price will reverse back down at the start of the 4th Quarter:- larger trend reversal and volatility
This is same pattern that occurred in January and April this year.
My preferred pattern is SET-UP A occurring, but after Friday's price action that might not be the case.
SET-UP A could be be verified by a Wednesday 'sell' pattern and price trading below 1129.75


