 DOW S&P Weekly charts
US markets heading down into June's lows and expectation prices are moving lower into July's lows. once around July's lows, I'll be looking for the next monthly counter-trend move back upwards.
"Overall US markets are trading below Monthly timeframe 50% levels, which favours further weakness down, however during the week of future contract expiry markets usually (not always) rise up into expiry next Friday.
Once that occurs, then there is a better chance of market continuing lower.
Ideal pattern in both markets is a continuation higher on Monday into the 5-day highs, which match the Weekly 50% level, and then push back down into support.
So the expectation is selling pressure around the Weekly 50% level (5-day highs).
If US markets are going to continue higher into expiry then price should then rise up off support and look for a 'HOOK' day back inside the Weekly 50% level.
A 'HOOK' day will favour a continuation upwards into Friday....
No HOOK day after a reversal pattern down early in the week, and price is following the Monthly trend down into the Weekly lows again....
Previous Weekly Report
 DOW S&P Daily
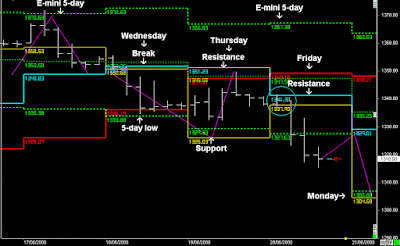
 US markets push up into the Weekly 50% levels and reversed back down towards the Weekly lows, as they push down into the June lows......
Both US markets pushed up into the 5-day highs and reversed back down into Support, but once Wednesday broke support then trend was down into Friday.
As mentioned in the Premium Report, expectation Thursday would find some short term counter-trend, but would probably push down on Friday once again as prices remained below the 5-day filter.
Next Week:- Push down into Monday's lows, and then we should be looking for a 2-3 day counter-trend move back up towards the Weekly 50% level...
- Daily Trading Set-ups & Analysis


