DOW S&P Weekly Report 28th June 2008

CNBC is now alerting that US markets are nearly in a 'BEAR' Market, but in fact that BEAR market began at the start of the January 2008, as prices pushed down from the Yearly 50% levels.

As previously mentioned many times, the counter-trend UP into MAY from March lows would be the time to go cash, as the expectation that all global markets would be moving down toward the lows once again, and continue lower July-Sept as price push down towards their Yearly lows for 2008


DOW Cash

Those yearly lows are shown above in the DOW, which now match the next Quarterly pattern in July-September...


S&P CASH Weekly

As shown above, around Yearly lows is where traders want to be moving back into stocks and financials looking for the next monthly counter-trend moves upwards.

Note:- As Mentioned previously any counter-trend move upwards from those lows is only seen as a reversal back into the monthly 50% levels, with the expectation that prices will move lower in 2009.

S&P Daily futures...

Pushing lower towards July's lows...

Trend guide downwards is the Weekly 50% level, but there could be a short-term counter-trend move back towards July's 50% level before continuing down...

S&P 5-day pattern

For day-traders the trend guide is the 5-day 50% level.....


  • Daily Trading Set-ups & Analysis
  • Index Futures SPI, DOW S&P, & Forex
  • Subscribe to the Trader Premium
  • http://www.datafeeds.com.au/premiumtrader.html


  • DOW S&P Weekly 21st June 2008

    DOW S&P Weekly charts

    US markets heading down into June's lows and expectation prices are moving lower into July's lows. once around July's lows, I'll be looking for the next monthly counter-trend move back upwards.


    "Overall US markets are trading below Monthly timeframe 50% levels, which favours further weakness down, however during the week of future contract expiry markets usually (not always) rise up into expiry next Friday.

    Once that occurs, then there is a better chance of market continuing lower.


    Ideal pattern in both markets is a continuation higher on Monday into the 5-day highs, which match the Weekly 50% level, and then push back down into support.

    So the expectation is selling pressure around the Weekly 50% level (5-day highs).

    If US markets are going to continue higher into expiry then price should then rise up off support and look for a 'HOOK' day back inside the Weekly 50% level.

    A 'HOOK' day will favour a continuation upwards into Friday....

    No HOOK day after a reversal pattern down early in the week, and price is following the Monthly trend down into the Weekly lows again....


    Previous Weekly Report

    DOW S&P Daily

    US markets push up into the Weekly 50% levels and reversed back down towards the Weekly lows, as they push down into the June lows......

    S&P 5-day pattern


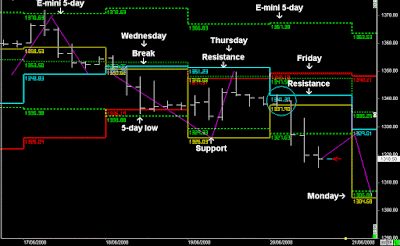
    Both US markets pushed up into the 5-day highs and reversed back down into Support, but once Wednesday broke support then trend was down into Friday.

    As mentioned in the Premium Report, expectation Thursday would find some short term counter-trend, but would probably push down on Friday once again as prices remained below the 5-day filter.

    Next Week:- Push down into Monday's lows, and then we should be looking for a 2-3 day counter-trend move back up towards the Weekly 50% level...

    • Daily Trading Set-ups & Analysis
  • Index Futures SPI, DOW S&P, & Forex
  • Subscribe to the Trader Premium
  • http://www.datafeeds.com.au/premiumtrader.html

  • DOW S&P Weekly Report 14th June 2008

    "I would look for a push down on Monday towards the 5-day lows and then look for a rotation back upwards later in the week and into next week's expiry June expiry.

    US markets broke the 3-week lows last Week, therefore an expectation is a two day counter-trend move upwards:- lower Weekly open....

    And then look for a continuation down into the Weekly lows....

    Once that price action occurs, then looking for a move back up towards Expiry"


    Previous Weekly Report


    DOW and S&P Weekly charts

    Overall US markets are trading below Monthly timeframe 50% levels, which favours further weakness down, however during the week of future contract expiry markets usually (not always) rise up into expiry next Friday.

    Once that occurs, then there is a better chance of market continuing lower.

    Note:- look at the gap to the 3-week highs, ideally the best set-up for any further weakness downwards would be occurring from the 3-week highs. That doesn't mean price is going to rise all the way back to those highs, it just means that US markets can go into another few weeks of rotating price action, which should align with the Month of July before the next 'thrust' pattern occurs.

    DOW S&P Daily charts

    Last Week's view was for a two day counter-trend before continuing lower because of the break of the Weekly lows.

    Next Week:- If US markets are going to continue higher into expiry then price needs to be trading above the Weekly and monthly 50% levels, which no doubt will form resistance levels...

    DOW 5-day pattern

    As pointed out in the Premium report, further weakness down on Wednesday after the 2-day stall, confirmed with a break of support, and later in the week price moves back upwards the closer it gets to expiry.

    Next Week:- Ideal pattern in both markets is a continuation higher on Monday into the 5-day highs, which match the Weekly 50% level, and then push back down into support.

    So the expectation is selling pressure around the Weekly 50% level (5-day highs).

    If US markets are going to continue higher into expiry then price should then rise up off support and look for a 'HOOK' day back inside the Weekly 50% level.

    A 'HOOK' day will favour a continuation upwards into Friday....

    No HOOK day after a reversal pattern down early in the week, and price is following the Monthly trend down into the Weekly lows again....


    • Daily Trading Set-ups & Analysis
  • Index Futures SPI, DOW S&P, & Forex
  • Subscribe to the Trader Premium
  • http://www.datafeeds.com.au/premiumtrader.html


  • DOW S&P Weekly Report 7th June

    "Last Week’s report mentioned the close below 3-week lows, and the potential of a two week consolidating pattern, which means 10 days of more rotation.

    Last Week completed the first week, and it looks like another Week before a new trend develops…

    A:- rotation back down into June 50% level next week and then a continuation back UP towards the recent highs. This often occurs in the month of contract expiry with a bias to rise into the switch from June contracts into September contracts."


    Previous Weekly Report...


    S&P Weekly & Daily charts

    Last Week expectation that the Weekly 50% along with the 5-day pattern will define another consolidating pattern around the June 50% level.

    S&P daily and 5-day chart

    This started with the higher Daily open and the Weekly 50% level on Monday, and then the rest of the week was defined by the 5-day pattern, including the 5-day highs on Friday.

    With the highest jobless rate since 1986 and a huge jump in oil, this sent the US markets down 400 points.

    Next Week....

    We have now completed a 10 day consolidating pattern, the following week future contracts in June come into expiry,which often pushes prices up towards the expiry date.

    I would look for a push down on Monday towards the 5-day lows and then look for a rotation back upwards later in the week and into next week's expiry. June expiry.

    Note: a break of the 3-week cycle lows 2 weeks ago is a bearish pattern, so at this stage any up move towards contract expiry is only seen as a short term counter-trend move within a 'bear' market.

    DOW Weekly and Daily Report

    US markets broke the 3-week lows last Week, therefore an expectation is a two day counter-trend move upwards:- lower Weekly open....

    And then look for a continuation down into the Weekly lows @ 12035.

    Once that price action occurs, then looking for a move back up towards Expiry and then use the July 50% level to trade down.