S&P and DOW futures 7th April 2014 Monthly Report

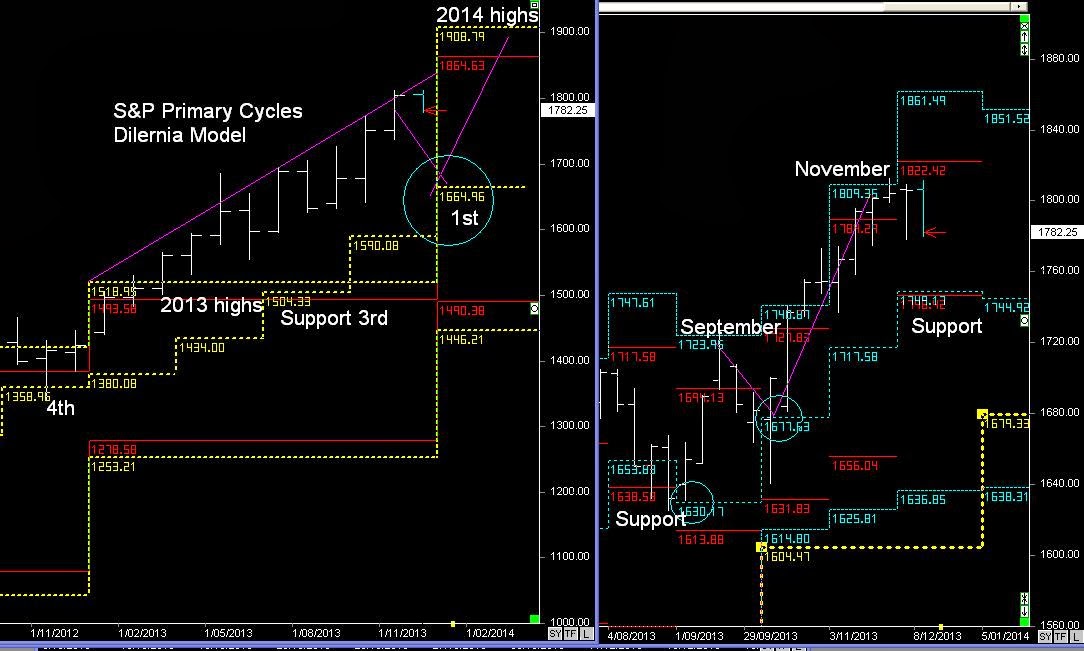
Primary trend suggests further gains towards the 2014 highs, as part of the 2013 break & extend pattern (Dilernia Principle)

Personally I would begin to unwind any margin LONG positions around those highs.
 Previous Monthly Report

S&P 500 Primary and Weekly cycles
 
Primary trend continues to remain stable, as it head up towards the 2014 highs.
 
I would being to off load any margin positions around those highs and move to the sidelines,
and wait for the next pullback in the Quarterly cycles, as illustrated in the next chart

 
DOW Primary cycles
 
The DOW is following text book Dilernia Principles, as it follows the Primary breakout in 2013 towards the 2014 highs, whilst the Quarterly dynamic support levels provide the precise re-entry points. Once again I would look to offload Margin positions around those yearly highs..

S&P 500 E-mini futures 3rd march 2014 Monthly Report

S&P Primary cycles

Primary trend suggests further gains towards the 2014 highs, as part of the 2013 break & extend pattern (Dilernia Principle)

Personally I would begin to unwind any margin LONG positions around those highs.

S&P Weekly cycles

MARCH 50% level is the trend guide and support within this current BULL trend.


S&P 500 E-mini futures 4th February 2014

S&P 500 Primary & Weekly cycles

Random Support around the February lows @ 1732, as part of a Primary breakout in 2013 and with the view towards the 2014 highs....

However, it will now need to be validated with a 3-week high breakout in the last month (MARCH) of the 1st Quarter in MARCH.

Short-term patterns will be based on the 5-day cycles and the levels in the Weekly cycles.

Long term support resides around 1670, but that moves up to 1730 in April.

S&P 500 E-mini Futures 24th December 2013

Primary & Monthly cycles

The S&P didn't precisely hit the support level @1749, but it nevertheless continues to follow the Primary Break-n-Extend pattern towards the 2014 highs, as part of Dilernia Principle from the 2013 highs.

For those trading the Primary trend, especially on Margin, I would begin to offload long positions around the 2014 highs/ January highs in the new year.

And then look for the forward trailing support levels within each Quarterly timeframe to move back in.

S&P 550 E-mini Futures 12th December 2013

S&P Primary & Monthly cycles

 The October 50% level support, as part of a 2-month wave pattern will complete around the November highs. This is a shorter pattern as part of the current 4th Quarter.
Therefore around November highs is a random Resistance zone in the current cycle (Previous Report)

As we can see the November highs have formed resistance and the cycles suggests that the trend will continue down into Support levels around 1749.

Long term trend bias is to continue towards the 2014 highs, as part of the 2013 Primary breakout.

Short-term support 1749 in the 4th Quarter.

Long term support in the 1st Quarter is 1665

S&P E-minis Futures 2nd November 2013 Monthly Report

S&P Primary & Monthly cycles

Trend bias is to continue towards the 2014 highs...

 The October 50% level support, as part of a 2-month wave pattern will complete around the November highs. This is a shorter pattern as part of the current 4th Quarter.

if price actually hit the 4th Quarterly support, then expectation would be a trend that would rise for the next 3-6 months.

Therefore around November highs is a random Resistance zone in the current cycle.

S&P E-mini Futures 1st October 2013 Monthly Report

S&P Primary & Monthly cycles

September remained stable, as it rose upwards from the monthly 50% @ 1630 level towards the September highs @ 1732.

The Primary trend suggests a continuation towards the 2014 highs, as the FED continues to pump money into the economy.

October 50% level is the Support level, but with the start of the 4th Quarter, we once again look for long term BUY zones.

Therefore, if below 1679, BUY zones remain around 1605-1616