SP500 E-mini futures 5th December 2021 Monthly Report


S&P Secondary & Primary Cycles

A month is a long time since my last report,  but if you were following me on twitter you would have seen that I mentioned that they would buy the market up into option expiry.

What was looking bearish 1 month ago, has completely changed and I would expect higher prices into December.

However, ideally a move down into the December level of 3924, test support, and then buy it up into the close of 2022.

SP500 E-MINI FUTURES 6TH NOVEMBER 2022 MONTHLY REPORT


S&P SECONDARY & PRIMARY CYCLES

    October low swing and 3,922 in the Secondary Cycles has formed resistance.

My longer-term view hasn't changed, the BEAR MARKET TARGET of 2,575 is still in play,
as well as 3,350 this month

Currently 3,715 in the Secondary cycles is supporting price and may see a rise up this week into the November 50% level 3,861 - resistance


S&P PRIMARY AND WEEKLY CYCLES

Next week's 50% level is support with an expectation is rising up into the November 50% level.

It wouldn't surprise me to see next week consolidating in a tight 5 days range and then head lower.

Below the Weekly 50% level, and its following the Larger cycles down 

follow me on twitter for daily analysis @timepricetravel 

SP500 OCTOBER MONTHLY REPORT PART 2 | 5th October 2022


SP500 SECONDARY & PRIMARY CYCLES

Rotations into 50% levels happen all the time, it's the 2nd week that will define the strength of the reversal. Will be hitting resistance around 3852- 3922. 2nd week, can set-up a Monthly move towards 4035-4063 (break)

SP500 Emini futures 1st October 2022 Monthly Report


SP500  Cycles

Start of the 4th Quarter, but I don't think there will be a large counter-trend move upwards like we saw at the start of July and the 3rd quarter - retest the break at 4287

There could be a short-term 1-3 week up move, but I think it will dip down into 3415- 3350 1st before it happens.

If I'm wrong and there is an up move at the start of October, the trend guide is 3602 (October lows) I think it will struggle to rise higher than 3780 - 3832 and then continue down into December.

My Crash levels are 2574 for 2022, 
but I don't think that's the low, the low will come in the 1st Quarter of 2023 (Feb/March) and lower prices, then we will see the mother of all counter-trend moves upwards. 

SP 500 E-mini Futures 5th September 2022


S&P 500 

We've seen a retest of the break at 4287 and rejection.

My view is that the trend is heading down in the 4th Quarter to 2770.

2770 will support price in 2022, however, I think there will be 1 more dip in early 2023 to new lows (levels to be defined at the close of 31/12/2022)

However, in the Short-term, my expectation is the the September lows around 3752 will do it's best to hold support for a number of weeks.

The trend guide is the 50% level in September 3965 (might push up to 4002 but fail)

S&P500 E-MINI FUTURES 7TH AUGUST 2022


S&P 500 PRIMARY CYCLES

1ST target reached and a July close above 4082 should see further gains in August to retest 4,287.

A bullish Market will reached 4410 in the last week of August

An Extremely Bullish Market will break higher in September in the 2nd week.

A bearish Market will fail around the 2022 50% level 4449,
and September closing below 4287.

If that happens, step aside, because my view of a Bear Market will be down into 2023 1st Quarter around 2,800

S&P 500 Emini Futures 2nd July 2022

S&P 500 YEARLY CYCLES

3671 has supported price and now has moved into July, with current support  around 3,751

If it follows similar patterns as 2018 and 2022, then we are looking for moves towards retesting the break of 4,287 and also the Yearly 50% level at 4,400

1st Targets 50% levels.

Price is consolidating around the 2022 Yearly lows, and even though they can fail, it normally happens in the last Quarter going into the 1st Quarter of 2023 - Break Extend Pattern

Fundamentally, there's so much bad news around that further weakness can see prices much lower, CRASH - 2,731


Upside moves will be confirmed with a break of the Weekly highs, 
which match the July 50% level 4,003


S&P500 Emini Futures 17th June 2022 Updated Report


S&P 500 Primary Cycles

Not surprised to see it spike down to 3257, as it did in 2020, but it's from July we begin to look for counter-trend moves If trading around 3257 coming into the end of the 3rd Quarter, there's a world of pain going into 2023 and much lower prices, which would be a 2022 Break & Extend Pattern down into new lows for 2023


S&P 500 Monthly Charts

We're coming down into levels that have previously provided a Target and also the Break & Extend Patterns from one Quarter into the Next. (3rd Quarter)

Similar Patterns in 2018 and also 2020

Down Target 3671 that may spike down to 3,257 Once we move into the 3rd Quarter, we begin to look for a retest of the break up at 4287.

S&P 500 E-mini Futures 5th June 2022 Monthly Report


S&P 500 Yearly & Weekly Cycles

The Target on the downside is the Yearly lows of 2022 
3830 - 3689

I would expect these levels to hold for the rest of this Quarter and probably provide June support.


Right into the 2022 Yearly lows and a decent bounce up into the June 50% level (I was expecting #Bitcoin to do the same)

The trend for the rest of the quarter will be based on the 2nd Quarterly lows of 4109.

It's either going to form support and push higher...

or

The June 50% level and the same Quarterly lows, form resistance into July and the start of the 3rd Quarter. 

S&P 500 E-mini Futures MONTHLY REPORT 11th May 2022

S&P 500 Yearly & Primary Cycles.

Once back under the Yearly 50% level and April 50% level it was all down hill.

MAY LOWS is a random support level, as often we can see 2nd weekly support patterns that rise up into the Weekly 50% level or highs and then sell down on the 3rd week.

The Target on the downside is the Yearly lows of 2022 
3830 - 3689

I would expect these levels to hold for the rest of this Quarter and probably provide June support.

The risk of the Yearly lows breaking most likely occurs late in the 3rd Quarter going into the 4th, which will result in a break and extend pattern in the Yearly range - 2023

Which often bottoms out in the 1st Quarter of 2023 and the end of the Bear Market


S&P 500 E-Mini Futures 4th April 2022


S&P Yearly and Weekly Charts

Whilst above the April 50% level, Target 2nd Quarter highs @ 4869

S&P 500 E-MINI FUTURES 6TH MARCH 2022


S&P 500 PRIMARY AND WEEKLY CYCLES

S&P 500 is in a Bear trend with the expectation that it's moving down down towards the 2022 lows later in the year. (Below the 2022 50% level)

Often when there is a double bottom in the monthly cycles (January & February), the month of March (3rd Month) can often have an upward bias to around 4500

However, I just can't see a fundamental picture that screams Bullish, and certainly not technically

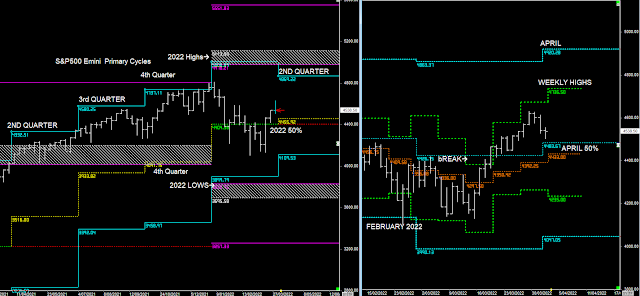
S&P 500 E-mini Futures 7th February 2022


S&P 500 YEARLY AND WEEKLY CYCLES


If there's early selling pressure at the start of January, then it's down into the 2022 50% level at 4405, then look for a potential bounce to follow the trend towards those 2022 highs
PREVIOUS REPORT

CURRENTLY SUPPORTED AROUND THE 2022 50% LEVEL

Looking at support in the Yearly range, as well as bouncing off the January lows, we would now look for a move higher, as long as it's above the February 50% level.

However, It would not surprise me to see February actually choppy going into March.

With February closes below the Yearly 50% level, then there's pain ahead. 


S&P 500 E-mini Futures 4th January 2022


S&P 500 Primary & Weekly Range

Completes the 100% range of the 2021 range and likely to move higher in the 1st Quarter towards the 2022 highs - 

You wouldn't want to be buying around 4879 -5006

If there's early selling pressure at the start of January, then it's down into the 2022 50% level at 4405, then look for a potential bounce to follow the trend towards those 2022 highs