S&P (e-mini ) 26th June 2010 Daily recap

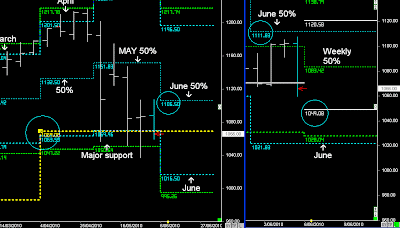
S&P Monthly & Weekly

Last week's reversal down from the highs and failure of the Weekly 50% level is now setting up the S&P to continue down into the 3rd Quarter lows. (July)

The UP trend was dependant on the weekly 50% level holding, but the 5-day low breakout on Tuesday gave us clues that wasn't going to happen.

Currently the 2nd Quarter 50% level (yellow) is supporting the S&P, but with the shift in the 3rd Quarter 50% the move is likely to continue down July towards the 3rd Quarter lows, with a possible move as far as the 969 (Single Year 50% level)

Next Week:- the market can continue to consolidate for the next 5-days until July begins and we use 1109 as resistance, or the Weekly 50% levels can send the S&P lower pushing July's lows closer to 969.

S&P (e-mini ) 19 June 2010 Weekly

S&P Monthly and Weekly

This week has seen the 3-week highs and June 50% level stall the market from rising, but not provide any major selling, and we can now see the Weekly timeframe close above 1106.50.


This has the potential to send the S&P upwards over the next 2-weeks... (July)

Support will be defined by 1105.75 for next week, and likely to follow the Weekly range upwards.

If next week decides to trend upwards then the Weekly highs have less probability to stall the market from Thursday onwards, and the 5-day highs have less probability to provide reversal patterns.


This week's close failed to move to the 5-day highs on Friday, and because of this pattern I don't have the view that next week will begin with a 2-day reversal pattern and move below 1105.75


Next Week is simply going to be defined by the June 50% level and 1105.75.


How far the next 2-weeks rises is random, but whilst above 1105.75 the trend is up until the start of the 3rd Quarter and the start of a new 3-month cycle.

S&P (e-mini ) 12 June 2010 Weekly

S&P Monthly and Weekly

S&P trading around higher timeframe support levels (3-Quarterly 50% levels 1074) but below the June 50% levels.


At this stage I'm treating the S&P as hitting resistance around the 3-Week highs and 3-month 50% levels in June.


Often the 3-week highs and 3-months 50% levels can send the trend back down, or at least keep June consolidating below the June 50% levels @ 1111.50

S&P (e-mini ) 5th June 2010 Weekly

S&P Yearly and Quarterly

As per Previous Weekly report, there is a chance that the S&P continues down towards the Yearly 50% level in the 3rd Quarter.

Friday has closed below the 3-Quarterly 50% level, which is bearish.....

And at this stage, whilst the market remains below the 3-month 50% level the bias is down, but the speed of the move towards 969 is unknown.


S&P Monthly and Weekly

2-month wave pattern completes around the June lows.

If the market was going to 'trend' down into 969 I would have preferred to have seen Friday closed near the June 50% level and then sold off from a higher Weekly open:- trust pattern.

Because of the current patterns we could end up with minor swing patterns (UP) next week, using 1049 as a random support level.

However, the overall trend remains bearish and pushing lower.