S&P 500 - Emini Futures 13th June 2020


S&P 500 Primary & Weekly Cycles


Next week's Weekly highs at 3153 will be a massive resistance level to begin with, and if it does go as high as 3153, there will be lot of shorter's trying to push it back down into 3007 and the Yearly 50% level.

It will be the week after next that we decide if S&P 500 is back into a BULL MARKET Trend (above 50% level)  - previous report


We saw a lot of selling this week, but not enough to turn us into Bears, even though the economy is awash with extremely negative news

Unless it's below 3007 the bias is up towards the 2020 highs, which matched the 3 month highs in July.

Do I want to be BUYing the market here?

Not really, because it can turn quickly and be back down to the 2020 lows at 2637 in a blink of an eye.

S&P 500 Emini Futures 30th MAY 2020 Monthly Report

S&P 500 Primary & Weekly Cycles

What could happen is, if price moves down into those weekly lows, but moves back above the MAY 50% level (Yellow), US markets might actually move up towards the 2020 50% level at 3007.

Therefore, There are probably a lot of traders SHORTING US markets now, and as much as I agree with them, they could end up getting squeezed on the upside if that plays out. (previous Report)


Can the S&P 500 actually go as high at the JUNE highs at 3380?


Next week's Weekly highs at 3153 will be a massive resistance level to begin with, and if it does go as high as 3153, there will be lot of shorter's trying to push it back down into 3007 and the Yearly 50% level.

It will be the week after next that we decide if S&P 500 is back into a BULL MARKET Trend (above 50% level)

Or the market begins to position itself coming into the end of the 2nd Quarter and the start of the 3rd Quarter, which is what I always believed was when the next round of selling will occur, but it needs to be below 3007

S&P 500 E-mini futures 2nd MAY 2020

S&P 500 - Emini (Primary & Weekly Cycles)

The Aussie Market looks like it's in a classic bear market set-up for more weakness, US markets not so much.

As much as I'm extremely bearish in the overall trend within the Primary cycles for more weakness into 2021, along with the Fundamentals supporting my view, the 2nd Quarter could actually continue to support the trend and not follow the Break and Extend pattern into the MAY lows but move higher.

US markets are still above the monthly 50% levels and there's a convergence of the Weekly channels, which normally signifies a breakout, therefore it needs to close below the Weekly lows to gather pace @ 2697

What could happen is, if price moves down into those weekly lows, but moves back above the MAY 50% level (Yellow), US markets might actually move up towards the 2020 50% level at 3007.

Therefore, There are probably a lot of traders SHORTING US markets now, and as much as I agree with them, they could end up getting squeezed on the upside if that plays out.

We then look towards the 3rd Quarter onwards, with 3007 being a major resistance zone.

S&P 500 E-mini Futures 19th April 2020

S&P 500 Primary & Weekly Cycles


We've seen the S&P 500 push up into the previous break in the Secondary Cycle at 2861.

With the amount of extremely negative fundamentals in the economy, I'm surprised it didn't sell down from the 50% level, instead of going up.

Can it go up higher?

It can go to the 50% level of 2020 at 3007.

What does this mean?

It means, then even though I'm extremely bearish, It actually might find support around the 2020 lows @2637 for the next 3 months.

S&P 500 Emini Futures 12th April 2020


S&P Primary & Weekly Cycles

As mentioned week's ago, retrace of the 50% of the range from the 100% lows in 2020

Thursday's close is exactly the 50% level @ 2785.75% of the range from the 2020 highs and the lows.

It could push up a bit more into 2861, however, everything around these levels are high risk on Longs.

The ideal pattern is a major sell down into the MAY lows.

Another bounce into higher highs, and then it all goes to shite in 2021.

S&P 500 E-mini Futures 8th April 2020


S&P Primary & Weekly Cycles.

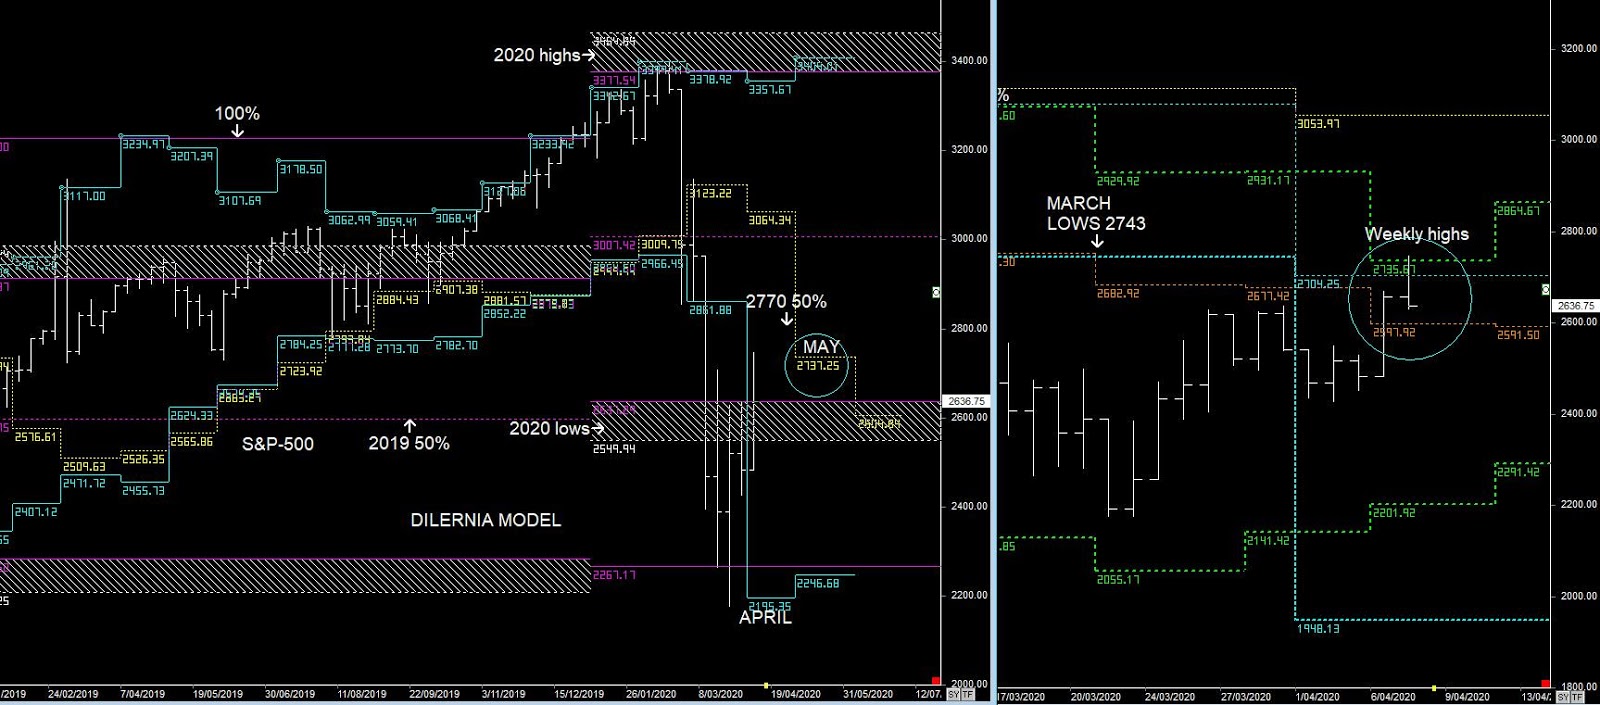
As I mentioned a numbers of Weeks ago, the S&P would swing up from the 100% lows in the Primary cycles and move towards the 50% level of the range between the 2020 highs and 2020 lows.

We saw the S&P hit and reach the Weekly highs and also retest the March low breakout @2743, which is what often happens in Bear markets - retest the breakout before it continues lower.

As you know I'm extremely bearish after this retracement,  but it won't surprise me if it takes a number of weeks to unwind.

That bearish sentiment can easily change, once governments start to re-open the economy, but technically it's down into 2021.

S&P 500 Emini Futures 5th April 2020

S&P 500 Primary & Weekly Cycles

There are so many resistance levels in the Above charts, that I can't see the S&P 500 going higher than 2770 (Weekly highs 2735)

Even though I'm expecting lower lows in 2021,  Markets could remain range bound between the 100% lows around 2160/2267  & 2743/70 for the next 6 months.

Nothing has really changed since me previous post.

It just looks range bound for a few months and with the expectation it's going to lower in 2021.

However, there is still the possibility that it does move up to 2770 before going lower