S&P E-minis Futures 2nd November 2013 Monthly Report

S&P Primary & Monthly cycles

Trend bias is to continue towards the 2014 highs...

 The October 50% level support, as part of a 2-month wave pattern will complete around the November highs. This is a shorter pattern as part of the current 4th Quarter.

if price actually hit the 4th Quarterly support, then expectation would be a trend that would rise for the next 3-6 months.

Therefore around November highs is a random Resistance zone in the current cycle.

S&P E-mini Futures 1st October 2013 Monthly Report

S&P Primary & Monthly cycles

September remained stable, as it rose upwards from the monthly 50% @ 1630 level towards the September highs @ 1732.

The Primary trend suggests a continuation towards the 2014 highs, as the FED continues to pump money into the economy.

October 50% level is the Support level, but with the start of the 4th Quarter, we once again look for long term BUY zones.

Therefore, if below 1679, BUY zones remain around 1605-1616


S&P 500 E-mini Futures 1st September 2013 Monthly Report

S&P Primary & Weekly cycles

Primary cycles suggests the trend will continue up into the 2014 Yearly highs...

Short term trend will be defined by the September 50% level@ 1630 that could see the trend remain stable.

However, the most robust pattern would be a move towards the 4th Quarterly 50% level around 1586 and then a continuation upwards.

S&P 500 e-mini Futures 3rd August 2013 Monthly Report

S&P Primary & Weekly cycles

As noted in the previous Report, the Primary cycles is driving the S&P towards the 2014 highs...

There is random Resistance around the August highs, with short-term Support around the Weekly lows @ 1671.

Note:- long term support resides around the Quarterly supports zones, if there is any weakness around the 'September- October' timeframes.

Current Support in the 3rd Quarter is around 1504, but in the 4th, just like in 2012, the support is dynamically moves upwards to 1586 (confirmed in October)


S&P 500 E-mini futures 29th June 2013 Weekly Report

S&P Primary & Weekly cycles

As noted in the last report, the Weekly 50% level is helping drive the short-term patterns, with a trend bias to move towards the Support levels in the Primary cycles:- 1504-1524

The Market remains above the 2013 highs, therefore the Primary cycles remain bullish, and current price action is seen as a pull back into Support, with the expectation it's going to continue higher into 2014.

Therefore, next week's 50% level will define whether the trend continues down, or not

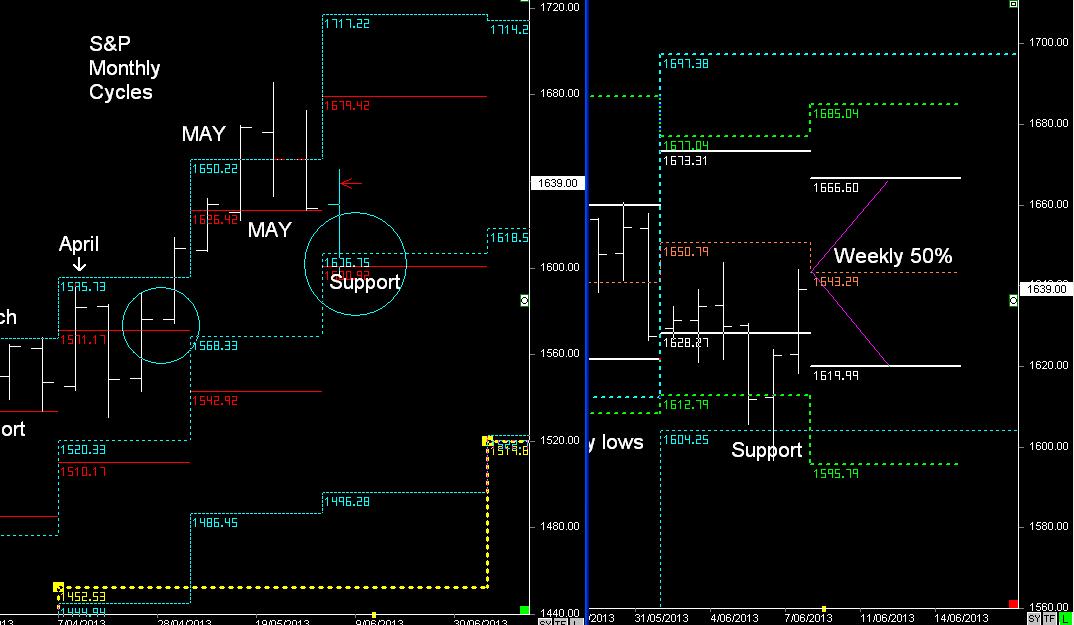
S&P 500 E-mini futures 8th June 2013 Weekly Report

S&P Monthly & Weekly cycles

S&P holding Monthly cycle support:- 5-day range pattern..

At this stage it looks like the trend remains bullish.

However, a sell off from the Weekly 50% level next week resulting in a break of Support is a bearish sign for a move towards the 3-month lows :- 1520  to 1496

S&P 500 E-mini Futures MAY 2013

S&P Monthly and Weekly cycles

As mentioned in the last report 4 weeks ago....

My view is that there's more chance that the S&P will continue higher in the last week of April & into the start of MAY:- HIGHER HIGHS. if I'm right, it should remain above 1571....

It did remain above 1571 in the last week of April, and then made a play for the MAY highs, which didn't form resistance in the way it normally does. Often the Monthly trend will fail to make more gains above the cycle highs (1658).

Keep an eye on the next 5-day as the market completes the MAY cycle and moves into the June cycle and a shift in Support levels...

Therefore the trend guide is going to be defined by the Weekly 50% level @ 1640