S&P 500 E-mini Futures 13th April 2013 Weekly Report

S&P Monthly & Weekly cycles

S&P obviously didn't move downward, but gathered strength once Monday started trading above the Weekly 50% level, helped by the Weekly high breakout @ 1567.

Two patterns at play next week, as to whether the trend continues with the Weekly break & extend pattern towards next week's highs @ 1599

Support @ 1571/74

Long term support resides around 1510-1520

S&P 500 E-mini Futures 6th April 2013 Weekly Report

S&P Monthly & Weekly cycles

1533 has held Support for the entire month of March, and now with the start of the 2nd Quarter, Support has shifted downward, towards 1510-1520....

Short-term trend will be defined by the Weekly level @ 1548...

Long term Support is around 1452, just in case things trip over in Korea and markets drop 'flash-crash'

S&P 500 Futures 23rd March 2013 Weekly Report

S&P Monthly & Weekly cycles

"Any weakness in the latter half of this month & 1533 is seen as Support" Previous Weekly Report


Weakness hit the markets as the Cyprus banking crisis began to unfold, sending the trend down into 1533, which ended up supporting the S&P 500.
If the trend is going to move up once again towards the March highs and then the April highs, the two trend guides are based on the Weekly levels....

Weekly 50% level @ 1542 & 1557

S&P500 E-mini Futures 16th MARCH 2013


S&P Monthly & Weekly cycles

MARCH highs @ 1567 could form resistance, but more than likely continue towards new highs in April.

Any weakness in the latter half of this month and the close of the 1st Quarter & 1533 is seen as Support

S&P 500 9th March 2013 Weekly Reports

S&P Weekly cycles

S&P completes the March high target @ 1548.

There's a breakout of the Weekly highs @ 1533 and often that can extend up into next week's highs @ 1564....

However, there's a Friday high pattern and if it's below 1548, then there's a short-term (2-day) pull-back into 1533/34

1533/34 is seen as a multi-day Support level.

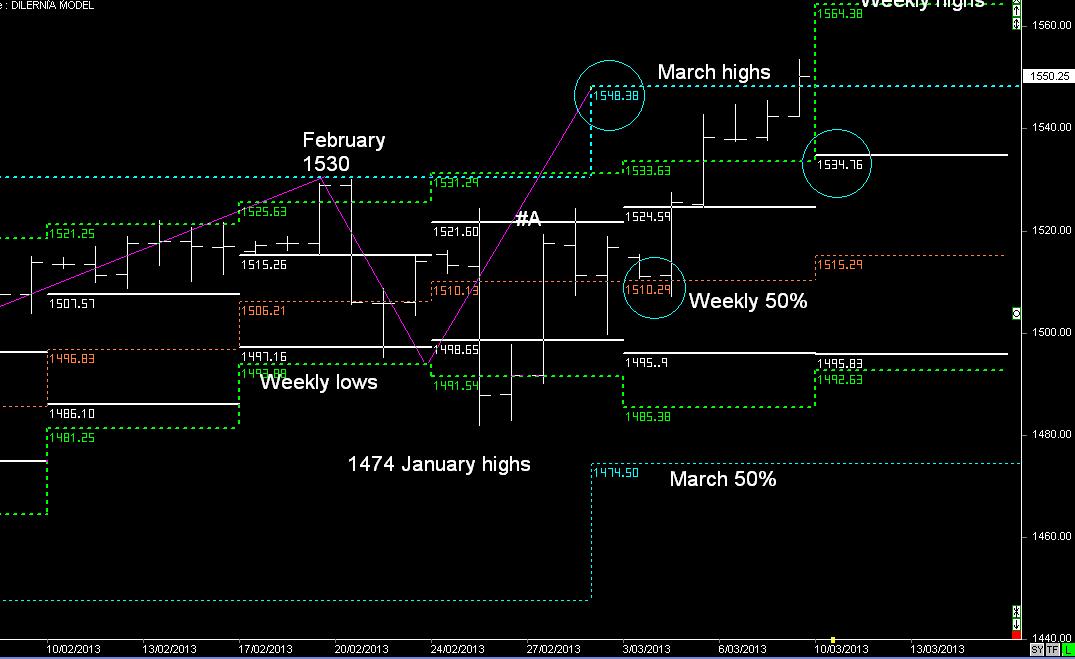
S&P 500 E-mini futures 2nd March 2013

SPI Monthly & Weekly cycles

S&P continues to remain in an upward trend:- Target March highs.


We saw a break of the Weekly lows earlier this week, but it didn’t precisely hit my downward target of 1474, but as we can see, it has quickly resumed its upward trend.

What we also notice is that the past 4 weeks price has struggled to break the random Resistance zone around 1520, but that's now pushed up into 1533 in March

Therefore there is still the possibility that there’s downward pressure towards 1474, which is now matched with the MARCH 50% level, and then continue up into the MARCH & then the April highs

1474 is seen as Support

S&P 500 E-mini Futures 24th February 2013

S&P Weekly cycles

Breakout of the January highs completed the break-n-extend pattern in the February highs @ 1530

Current price action and Support around the Weekly lows on Thursday now sets up the S&P to continue to move upwards and follow the montlhy cycles in March:- higher highs.

There is a random resistance level around 1521, and if it fails to break that level for the next 5-days, then early in March there could be a short & swift move down into 1474, as part of retesting the January highs...
and then the trend should continue to move upwards for the rest of 2013.