S&P 500 E-mini futures 18th February 2012

S&P Monthly and Weekly cycles

My view last week was that 1352-54 would act as resistance and continue down towards the Weekly lows over the coming weeks.

Everything looked like it was going to play out accordingly when Wednesday closed below the Weekly level @ 1342.50

However, positive US Jobs & housing reports on Thursday sent the S&P back towards the Weekly highs.

The rest of this month is now based on 1352-54

if below my view remains intact, of the market rotating downward...

but whilst above, the market could be following the monthly cycle up towards 1396, by the end of the February, early March.

S&P 500 E-mini Futures 11th February 2012

Once it reaches the February highs it will complete the Monthly cycle wave patterns, therefore I would begin to look for pullbacks longer in length to around the Trailing Weekly lows.


Any reversal patterns will only be confirmed by price moving back inside the Weekly levels, and that might not happen until the 3rd Week in February.

S&P Weekly cycles

2-month wave pattern complete at the February highs (resistance) 1352

My view is that it will try and unwind down towards the Weekly lows over the next few weeks.

if I'm right it should remain within the weekly levels (Below 1342.50).....

otherwise it can continue to push up towards the Weekly highs 1358.

S&P 500 E-mini 4th February 2012 Weekly Report

Monthly & Weekly cycles

2-month wave pattern into the February highs will complete next week after finding support at this week's 50% level @ 1298

The current price action started from the December 50% level in the 4th Quarter of 2011, and has now reached the first quarter highs:-  break and extend patterns.

Once it reaches the February highs it will complete the Monthly cycle wave patterns, therefore I would begin to look for  pullbacks longer in length to around the Trailing Weekly lows.

Any reversal patterns will only be confirmed by price moving back inside the Weekly levels, and that might not happen  until the 3rd Week in February.

S&P 500 E-mini futures 28th January 2012 Weekly Report

The S&P is about to hit the January highs @ 1314, as part of the extension pattern from the December 50% level :- This Monthly high is seen as resistance level.

However, there is also the single monthly breakout @ 1278 (RED), which could result in the price action extending up towards the new February highs, as part of a 2-month wave pattern during the 1st quarter.


S&P Weekly cycles

S&P is currently trading around the January highs @ 1314.

These resistance levels will disappear in  two days time, and extend up towards the February highs. (potential 2-month wave pattern during the first quarter.

In the short-term, the focus should be trading the current break out pattern from 1278.


 The completion of the Break and Extend pattern is around 1235.


Trend guide on whether price moves up or down in the first 2-3 days will be determined by the Weekly level @ 1314

S&P 500 E-mini 21st January 2012 Weekly Report

S&P Weekly and Daily cycles


The S&P is about to hit the January highs @ 1314, as part of the extension pattern from the December 50% level


These Monthly highs are seen as resistance levels that could result in the last week of this month (next week) begin a reversal pattern back down towards the Weekly 50% level & 1278 (5-day reversal pattern).

However, there is also the single monthly breakout @ 1278 (RED), which could result in the price action extending upwards towards the new February highs, as part of a 2-month wave pattern during the 1st quarter.

These 2-month wave patterns are described in the Book. That means the S&P moving as high as 1340.

Next Week:- The Short-term trend will be defined by next Week’s levels, whilst using sets-ups in the 5-day daily cycle range.

S&P 500 E-mini 14th January 2012 Weekly report

Primary range remains Bullish, as per previous Weekly Report.

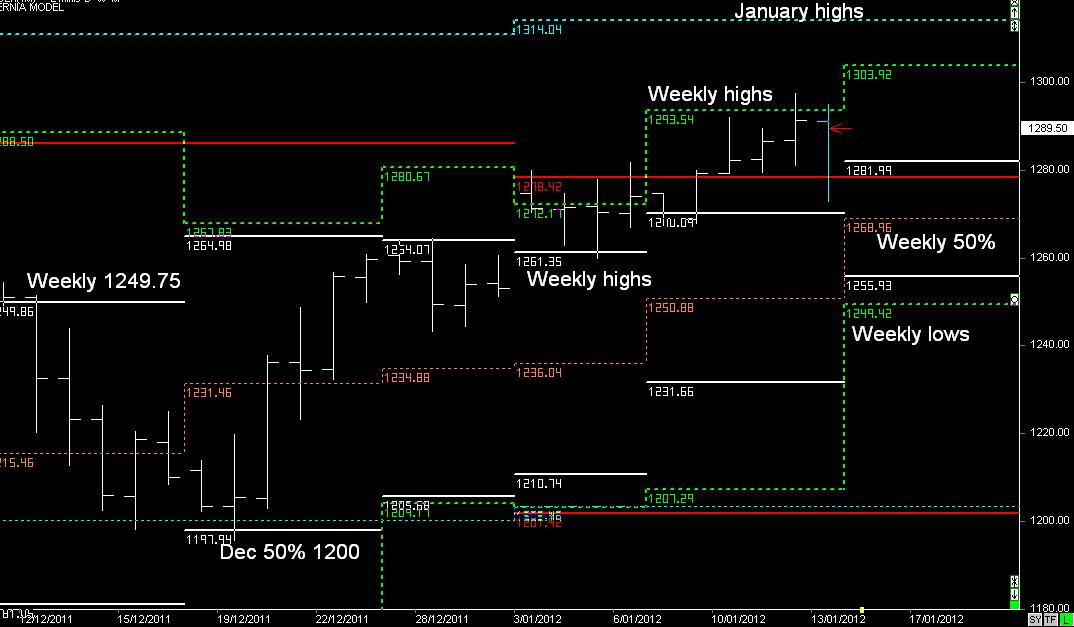
We have a December 50% level support pattern, which often suggests an extension upwards in the current month:- Target January highs @ 1314.

If the market follows the Weekly cycles upwards, then it might take a number of weeks to reach its target, as long as it remains above 1270...
Previous Weekly report


S&P Weekly cycles

The previous 5-days has continued to follow the dynamic Weekly cycles remaining above 1270, as part of a move towards the January highs.

The upward trend is based on the higher timeframe December 50% level support pattern and extension towards the January highs @ 1314, whilst the Weekly highs act as random resistance zones. (8.5 to 14 points)

Same pattern for next week:- trend bias is to continue higher...

as long as it's above 1278-82.

Trailing support level is the Weekly 50% level @ 1269

Anything below the Weekly lows @ 1249, puts the current upward trend at RISK.

S&P 500 E-mini futures 7th January 2012

S&P Weekly Cycles

Primary range remains Bullish, as per previous Weekly Report.

We have a December 50% level support pattern, which often suggests an extension upwards in the current month.

Target January highs @ 1314.

If the market follows the Weekly cycles upwards, then it might take a number of weeks to reach its target.

As long as it remains above 1270